* * *
Since the late-August drop in equities, we have discussed how we expect markets to react in the weeks and months ahead (post and post). Here is a short recap:
- Our assumption is that equities are not in the process of starting a bear market, but simply correcting within the context of an ongoing bull market.
- Why? Most bear markets coincide with a looming recession. It's not all perfect but the balance of economic evidence is positive (a recent post on this is here).
- US equities have risen 80-100% in the past 3 years, and indices have been higher every year for six years in a row. This has been a strong uptrend.
- Corrections within bull markets are normal. For context, this is the first correction in more than 3 years. Again, the uptrend has been strong. Bull markets do not end with the first correction in several years.
- When price falls, the price pattern looks scary and breadth looks terrible. Stories in the media emphasize the risks of investing. These are when longer term lows form. More likely than not, that is where equity markets are now.
- After waterfall events like that in August, indices will often rally as much as 10% and also retest their lows a month later. That is the pattern we are witnessing now. It's not hard to imagine that this process will continue into October.
- The increase in volatility makes short term activity subject to wild reversals, exactly as we have seen in the past month. This is likely to persist into the next month.
- On a year-end view, the washout in breadth and bearish sentiment provides an attractive risk/reward to accumulate equities on sell offs near the August low.
Two weeks ago, our expectation was that seasonally bullish September OpX could rally SPY back to the start of the waterfall from late-August, between 202-204. In the event, the high last week was 202.9. The week after September OpX is the weakest of the year for equities: our target was the bottom of the past one-month range:185-190. In the event, the low this week was 190.6 (original chart and comments here).

Our view continues to be that accumulating near the August low is attractive with an eye on the year-end. Whether SPY trades to or below the August low is frankly anyone's guess. The balance of evidence says the low should hold.
SPX has had 11 waterfall events since 1950; 9 of these 11 formed a final low within a few percent of the original low. On average, the final low was 5 weeks after the original low; that implies a final low could come by the end of next week (data from Dana Lyons).

A low next week would fit the seasonal pattern. September usually ends soft and next week (#39) has been one of the 5 worst weeks over the past 10 years (data from Ryan Detrick).

What is noteworthy now is that in the past month, SPX has not come within even 2% of its original low on August 25. This implies that the original low was an extreme and not an intermediate step on the path to much lower prices.
In similar cases since 1929 (where equities did not come within 2% of their original low after a month), SPX was higher 3 months later 9 out of 10 times by an average of 5%, and higher 6 months later 8 of 10 times by an average of 11%. In short, the price pattern over the past month suggests this is highly likely to be a correction within a bull market and not the start of a bear market (data from Sentimentrader).
In similar cases since 1929 (where equities did not come within 2% of their original low after a month), SPX was higher 3 months later 9 out of 10 times by an average of 5%, and higher 6 months later 8 of 10 times by an average of 11%. In short, the price pattern over the past month suggests this is highly likely to be a correction within a bull market and not the start of a bear market (data from Sentimentrader).
Positive returns through year-end is also the dominant pattern when SPX makes a 6-month low in August, as it did this year. Most of the time, that low is revisited by early October but SPX ends the year with an average gain of 3% in the final 4 months of the year, implying a close near 2050 at the end of December (data from Dana Lyons).

Should September end lower (with a close below 196.7 in SPY), there is also precedent for the final 3 months of the year to end strongly: since 1930, 14 of 18 closed higher with a median gain of 5.4% (data from Jeff Hirsh).


Should September end lower (with a close below 196.7 in SPY), there is also precedent for the final 3 months of the year to end strongly: since 1930, 14 of 18 closed higher with a median gain of 5.4% (data from Jeff Hirsh).

While October has a reputation as being the worst month of the year for stocks, this hasn't been the case. Over the past 20, 50 and 100 years, returns have been positive in October. Perhaps more importantly, the November to January period is the strongest 3 month stretch of the year, something to bear in mind should equities weaken further during October (data from Bespoke).

Volatility is likely to remain elevated. This is the pattern after waterfall events like that seen in August, a point we have stressed repeatedly. To wit, in the past 6 trading days, the average overnight gap in SPX has been a substantial 0.8% and the trading range over the past week has been nearly 6%. October has the highest average daily volatility of the year, so expect the trading range to remain wide and loose (data from Ryan Detrick).

The consensus among investors is that equities will endure substantial further loses and that the risk/reward for longs is poor. That is perhaps not surprising given the elevated volatility in the market. But what is remarkable is that sentiment has continued to become more bearish even as equities have refused to even come within 2% of their original low from more than a month ago.
The normalized flow of money into funds that gain when the market drops has only once been higher in the past 13 years. Each of these spikes in money flow into bear funds has corresponded with a relative low in equities (data from Sentimentrader).

Fund managers polled by BAML now hold the highest amount of cash (5.5%) since 2008-09. Moreover, their allocation to equities is the lowest in over 3 years. Both cash and equity allocations are at levels from which stocks have usually moved higher in the past (a post on this is here).

The Citibank Panic/Euphoria model has moved further into 'panic' territory over the past two weeks. It is now at a level where SPX has never been lower over the next 12 months and has most often gained more than 10% (green shading).

Investors Intelligence bulls minus bears reached a new 4-year low this week; in the past 10 years, SPX has been higher over the following months, with the sole exception of the cataclysmic drop in late 2008, a period which has little resemblance to today.

Investor bearishness is centered on a belief that the US economy is sliding into a recession. This is not likely.
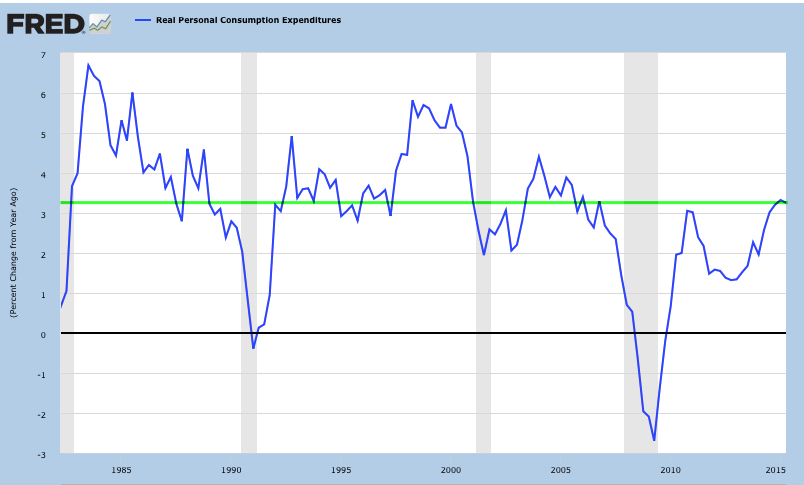
In today's GDP report, personal consumption expenditures (which makes up about 70% of GDP) grew at an inflation-adjusted rate of 3.3% in the past year, one of the highest growth rates in the past 10 years. The trend heading into prior recessions has been for the rate of growth to weaken; the current trend is strengthening.
New business formation has reached a new all-time high. Again, the trend is strengthening (data from Morgan Stanley).

Corporate profits in the US have grown more than 8% in the past year. They reached a new all-time high in the period to June. The trend is strengthening.

There is no disconnect between corporate profitability and the economy. The index of Coincident Economic Indicators (CEI) also reached a new high in August. There is a strong positive correlation between the CEI and corporate profits (data from Yardeni).

To be clear, the data is not all perfect. Durable good orders are weak, as is industrial production. SPX company revenue growth is modest and profit margins are more likely to contract than to continue expanding. Valuations, especially on a price/sales basis, are very high and this will likely cap upside gains on a longer term basis. Growth outside of the US is a wildcard.
But it's never perfect in the markets, and the balance of data shows a stable, growing economy and an excess of investors with heightened concerns of a recession. In a bull market, this is where lows typically form.
The week ahead contains two significant events. The latest employment and wage data will be released on Friday. Congress is also threatening a shutdown of the government on Thursday, October 1. While this sounds bearish, equities rose in the month following the last 3 shutdowns (including 2013). Overall, the pattern is nearly random (data from Sentimentrader).

Our summary table follows.


If you find this post to be valuable, consider visiting a few of our sponsors who have offers that might be relevant to you.