* * *
A year ago, we wrote a post on why "Year 3 of The Presidential Cycle Is Unlikely To Go The Way Everyone Expects" (here). At the time, SPX had risen 10% in the prior two weeks. The consensus was firmly in the camp that this performance would continue. After all, since 1950, SPX has risen an average of 22% during this phase of the cycle. In the past 60 years, Year 3 has never provided a negative return.

Our conclusion was that this pattern was unlikely to continue. The summary was this:
The set up for 100% of Year 3s is missing. And if Year 3 follows the script, valuations would be higher than at the top of the tech bubble and the Dow would have blown away even its impressive winning streak from the 1990s. Count us as being skeptical.
The hockey stick returns a hundred articles have led investors to believe are a sure thing in the coming Year 3 seems improbable. It's likely to be a trickier year than almost anyone now expects.This follow up post is not a victory lap, but intended to demonstrate a basic principle that is key to analyzing markets: patterns work for a reason, and if that context is missing, the pattern will probably fail. In the event, this is what has happened. Instead of gaining more than 20%, the index is 3% lower than a year ago.
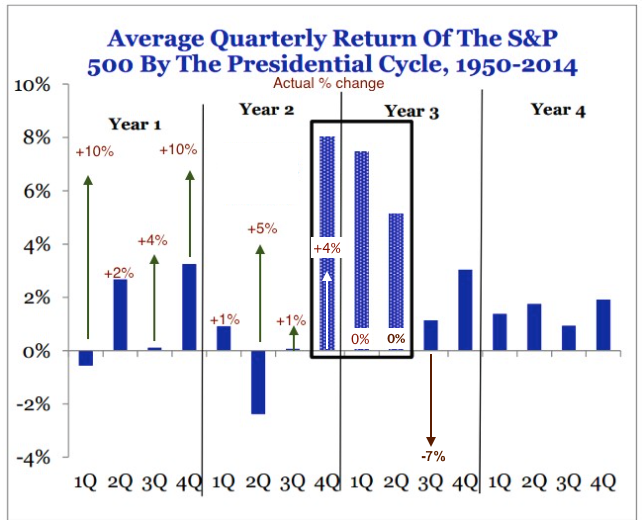
Part of our rationale was very simple: the "actual pattern" in Years 1 and 2 leading into Year 3 didn't match the "typical pattern". Years 1 and 2 are supposed to shake out investors to set up a booming Year 3. Instead, Years 1 and 2 had actually posted strong gains. The context was all wrong. The chart below shows how SPX has actually traded relative to its typical pattern.
This brought up a basic point about why Year 3 is usually bullish.
If nothing else, take away from this post that major bear markets, corrections of 20% or more and/or recessions have ended right before many Year 3s. In fact, this has been the case in 18 of the past 21 cycles (86%).
This is the single most significant feature explaining why Year 3 has been so bullish: the period leading into Year 3 has been decidedly bearish.

What happens next? The irony now is that Year 4 (yellow shading) is typically one of choppiness and small gains, exactly the kind of market seen in the past year. We'll have more to say about this before too long, but it might be time to expect something completely different.

If you find this post to be valuable, consider visiting a few of our sponsors who have offers that might be relevant to you.