Friday, September 30, 2016

Has The Fed's Policy Decisions Propped Up Equities?

Summary: The stock market rises on days when the FOMC releases its policy statement, probably as a result of some uncertainty being removed for market participants. This pattern has existed for more than 30 years. The Fed's ability to "jawbone" the market higher is no more exceptional now than it was during any prior bull market.

* * *

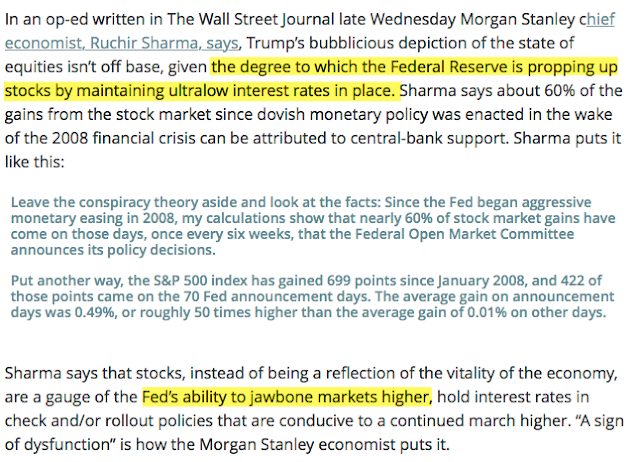
Morgan Stanley's chief economist this week stated that the Fed's low rate policy and "jawboning" are responsible for most of the stock market's gains since 2009.  In doing so, Sharma is repeating the popular meme that the Fed's actions have been exceptional in pushing the market higher (from Market Watch). Enlarge any image by clicking on it.


Is this view accurate?

Sharma is correct in saying the stock market typically rallies on days when the FOMC announces its policy decisions. That's not terribly surprising: rate decisions represent some uncertainty which is resolved with the release of the policy statement. That investors are continually uncertain about Fed policy is a testament to its ability to keep complacency in check. This is remarkable, moreover, since Fed policy very rarely changes.

But where Sharma is wrong - and this is the key point - is in saying that the Fed's "aggressive monetary easing" and policy utterances have had an anomalous influence during the current bull market.  They haven't.

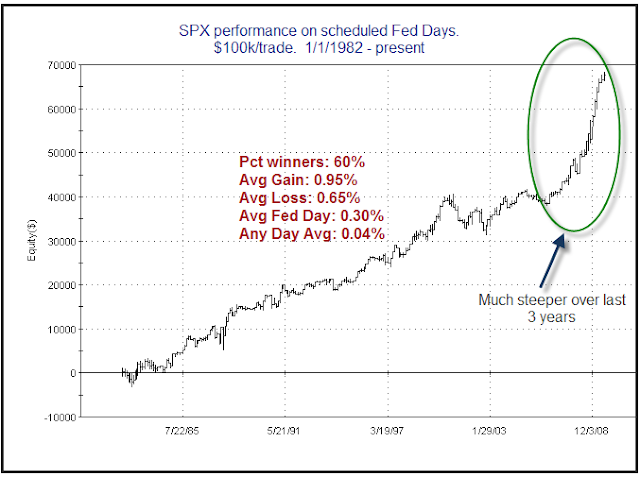
Quantifiable Edges (bookmark it here) has repeatedly looked at the performance of the S&P on days when the FOMC policy statement is released. From 1982 to mid-2009, the average FOMC day outperformed the average of all days by 7.5 times. Gains on FOMC days were common during the 1980s, the 1990s and became more exceptional during the 2000s, both during and after the 2003-07 bull market (chart below as of September 2009).
Friday, September 23, 2016

Interview with Financial Sense on US Macro and Equities

We were interviewed by Cris Sheridan of Financial Sense on September 21, the day of the FOMC rate decision. During the interview, we discuss the good and the not so good within the macro environment, the Fed, corporate fundamentals, investor positioning and what all of this means for US equities in the months ahead.

Our thanks to Cris for the opportunity to speak with him and to his editor for making these disparate thoughts seem cogent.

Listen here.


If you find this post to be valuable, consider visiting a few of our sponsors who have offers that might be relevant to you.

Monday, September 19, 2016

Live at Stocktoberfest on October 14

I'll be on a panel with Mark Dow, Jack Little and Eddy Elfenbein at Stocktoberfest in Coronado, CA on October 14. We'll be discussing global macro.

Mark is a former policy economist with the US Treasury and the IMF. Jack is the CEO of Mercenary Trader. The panel will be led by Eddy Elfenbein, editor of Crossing Wall Street.

Details are here.


Wednesday, September 14, 2016

Fund Managers' Current Asset Allocation - September

Summary: Even after the sell-off over the past week, global equities are more than 15% higher than in February. A tailwind for this rally has been the bearish positioning of investors, with fund managers' cash in February at the highest level since 2001. Similarly, their equity allocations in February had only been lower in mid-2011 and mid-2012, periods which were notable lows for equity prices during this bull market.

Remarkably, allocations to cash in September are as high as in February and allocations to equities are now even lower. Investors have jumped into the safety of bonds, with allocations rising to a 3 1/2 year high in June and July.  Overall, fund managers' defensive positioning supports higher equity prices in the month(s) ahead.

Allocations to US equities had been near 8-year lows over the past year and half, during which the US outperformed most of the world. After rising the past two months, allocations fell again to underweight in September. Bearish sentiment remains a tailwind for US equities. European equity markets, which had been the consensus overweight and also the world's worst performing region, are now underweighted relative to their long term mean.  Investors are chasing the world's best performing region - emerging markets - which now have their highest overweight in 3 1/2 years.

* * *

Among the various ways of measuring investor sentiment, the BAML survey of global fund managers is one of the better as the results reflect how managers are allocated in various asset classes. These managers oversee a combined $600b in assets.

The data should be viewed mostly from a contrarian perspective; that is, when equities fall in price, allocations to cash go higher and allocations to equities go lower as investors become bearish, setting up a buy signal. When prices rise, the opposite occurs, setting up a sell signal. We did a recap of this pattern in December 2014 (post).

Let's review the highlights from the past month.

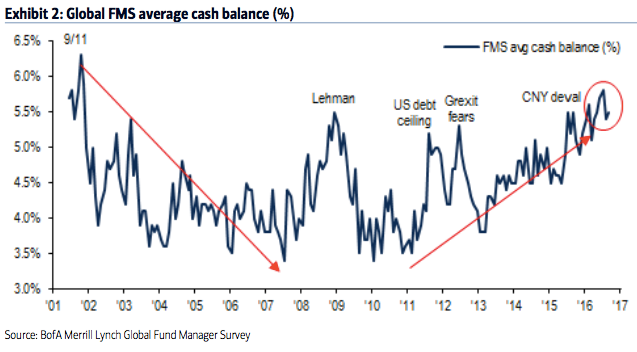
Cash: Fund managers cash levels at the equity low in February were 5.6%, the highest since November 2001 and higher than at any time during the 2008-09 bear market. Cash has remained high ever since: it peaked at 5.8% in July and is only modestly lower in September at 5.5%. High cash levels are supportive of further gains in equities in the month(s) ahead. Enlarge any image by clicking on it.


Monday, September 5, 2016

September Macro Update: Consumption Growing 3% and Housing Sales at a 9 Year High

SummaryThe macro data from the past month continues to mostly point to positive growth. On balance, the evidence suggests the imminent onset of a recession is unlikely.

Overall, the main positives from the recent data are in employment, consumption growth and housing:
  • Monthly employment gains have averaged more than 200,000 during the past year, with annual growth of 1.7% yoy.  Full-time employment is leading.
  • Recent compensation growth is the highest in 7 years: 2.7% yoy in July and 2.4% in August. 
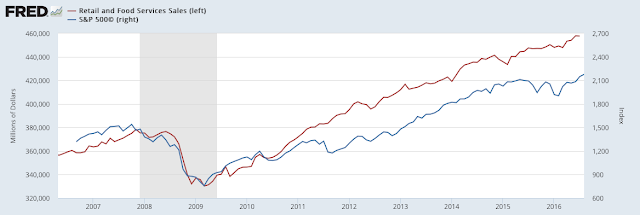
  • Most measures of demand show 3-4% nominal growth. Real personal consumption growth in July was 3.0%.  Retail sales reached a new all-time high in July.
  • Housing sales are at a new 9 year high. Starts and permits in July remain near their 8 year highs.
  • The core inflation rate has remained above 2% since November 2015.
The main negatives are concentrated in the manufacturing sector (which accounts for just 10% of GDP):
  • Core durable goods growth grew 0.2% yoy in July, its first gain since April 2015. It was weak during the winter of 2015 and it has not rebounded since. 
  • Industrial production has also been weak, falling -0.5% yoy due to weakness in mining (oil and coal). The manufacturing component grew +0.4% yoy.
Prior macro posts from the past year are here.

* * *

Our key message over the past 2 years has been that (a) growth is positive but slow, in the range of ~3-4% (nominal), and; (b) current growth is lower than in prior periods of economic expansion and a return to 1980s or 1990s style growth does not appear likely.

Modest growth should not be a surprise. This is the typical pattern in the years following a financial crisis like the one experienced in 2008-09.

This is germane to equity markets in that macro growth drives corporate revenue, profit expansion and valuation levels. The saying that "the stock market is not the economy" is true on a day to day or even month to month basis, but over time these two move together. When they diverge, it is normally a function of emotion, whether measured in valuation premiums/discounts or sentiment extremes (enlarge any image by clicking on it).


A valuable post on using macro data to improve trend following investment strategies can be found here.

Let's review each of these points in turn. We'll focus on four macro categories: labor market, inflation, end-demand and housing.


Employment and Wages

The August non-farm payroll was 151,000 new employees less 1,000 in revisions.

In the past 12 months, the average gain in employment was 204,000.

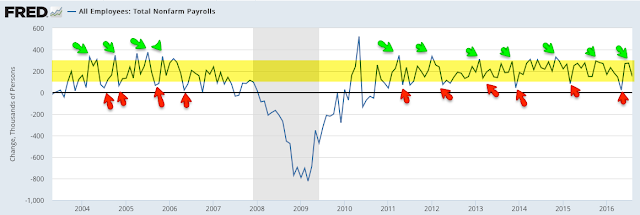
Monthly NFP prints are normally volatile. Since 2004, NFP prints near 300,000 have been followed by ones near or under 100,000. That has been a pattern during every bull market; NFP was negative in 1993, 1995, 1996 and 1997. The low prints of 84,000 in March 2015 and 24,000 in May 2016 fit the historical pattern. This is normal, not unusual or unexpected.