The FOMC is likely to lower its guidance rate tomorrow. When the economy is expanding and stocks are near their highs (like now), this has been a net positive for equities.
Sentiment data is inconclusive, but a 3-5% decline wouldn't be unusual at this point, especially as the typically weak August-October period is now here.
* * *
The rally since early June has carried SPX more than 10% higher in just two months. July will likely end with US equities higher for the 6th time in the past 7 months (table from alphatrends.net). Enlarge any chart by clicking on it.

It's hard to argue that the trend is anything but higher. In the past week, SPX, NDX, COMPQ, and the very broad NYSE, Russell 3000 and Wilshire 5000, have all closed at new all-time highs (ATH).
The worst that can be said about trend is that there is a loss of momentum (top panel). In real-time, timing when that will matter is very hard, but a drop of 2-3% (or more), until momentum is 'oversold' (circles), would be normal.

SPX continues to grind higher (top panel) as volatility remains embedded under 16 (bottom panel). 2950 marks the point at which SPX broke out higher, making it the main level of interest on weakness.

Remember, stock markets don't normally remain placid for very long. It's been two months since a fall of more than 2%; even the 2013-14 period, during which SPX rose more than 50%, saw drops of 3% or more 11 times, or every other month on average.

The Bollinger Bands on SPX are the tightest since October 2018 (lower panel), just before the sell-off that lasted until Christmas Eve. Similar compressions in volatility in the past have typically been followed by a spike in VIX (middle panel). It would be normal for SPX to make a move to its lower Bollinger in the days/weeks ahead (top panel).


The longer term trend in equities has strong historical probability of continuing higher into year-end.
First, since 1950, when SPX has risen strongly in the first half of the year (like now), it has risen further (by a median of another 10%) in the second half 86% of the time. The two exceptions were in 1983 and 1986, in which SPX closed the year a scant 2% and 3% lower, respectively (from Schaeffer's).

Likewise, since 1950, any 6 month rally that carries SPX at least 15% higher (like now) has been followed by further gains (of 8% on average) the next 6 months 93% of the time (from Troy Bombardia).

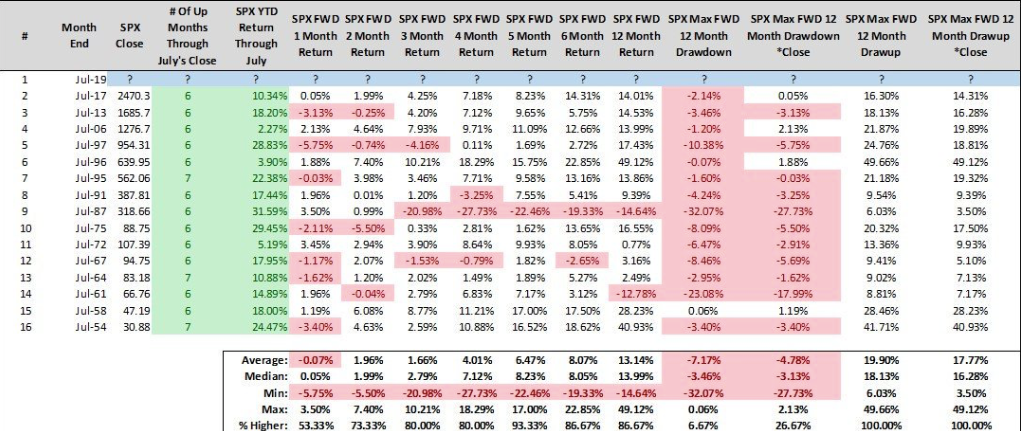
Similarly, since 1954, when SPX has risen 6 of the first 7 months of the year (like now) it has closed the year higher (by a median of 8%) 15 of the last 16 times (94%). The minimum draw-up during the next 5 months has been 6% from Steve Deppe).
The strong rally has already exceeded Wall Street strategists' year-end target for 2019. Since 1999, when SPX has already met the year-end target by mid-year, the index has continued to rise through year-end by a median of 10% (from Sentimentrader; to become a subscriber and support the Fat Pitch, click here).

Tomorrow, the FOMC is very likely to announce a cut in its guidance rate. Two months ago, we wrote why that has been bullish for equities (read that post here). Some further context follows (from Bespoke).

Since 1971, SPX has always risen 3, 6, 9 and 12 months after the first rate cut when the Leading Economic Index (LEI) has been positive (like now; the next two charts from Thomas Lee).


It might seem strange that the FOMC is cutting rates with equities near their ATHs. It's not. Since 1980, the Fed has cut rates with SPX within 2% of an ATH 17 times. Stocks have been higher (by a median of 10%) a year later all 17 times (the next two charts from Ryan Detrick).

That the rate cut is coming during the summer months could be a short term headwind for equities: August and September have historically been weak months for SPX.

That has especially been the case in pre-election years (like now). Both SPX and NDX have tended to drop and chop the next 3 months before rallying strongly from a low in October through year-end (from Jeff Hirsch).

Could this year be different? Yes. NDX has done well in August and September in those years when both SPX and NDX have started the year strongly (like now). That doesn't preclude interim weakness, but it could well be short-lived (from Steve Deppe).

Sentiment data is inconclusive. Fund flow data and retail sentiment suggest upside; newsletter writers and options data suggest caution.
First, Investor Intelligence bulls now exceed bears by more than 40%. That's been an inconsistent tell but, on balance, it suggests more caution is now warranted (red lines).

Similarly, over the past month, options traders have been buying more calls and fewer puts - a bullish bias. Again, that isn't always bearish for SPX - see 2013 and 2017, for example - but a 3-5% decline wouldn't be unusual at this point (red lines).

Retail investors polled by AAII, however, are not bullish: over the last 4 weeks, bulls barely exceed bears. A 5% correction can happen any time, but anything more is almost always preceded by retail sentiment that is far more bullish than now.

Interestingly, active investors polled by NAAIM were 96% bullish last week. You'd guess that was an extreme worth noting, but in the past, SPX has underperformed in the next 1-2 weeks but not beyond that. A month (or more) later, SPX was higher more often than normal (from Troy Bombardia).

While it might seem like the IPO market is especially hot and bubbly, it's not. It's acting normally and, thus, not sending a signal that investors are too bullish (from MarketWatch).

Economic data has not been great - that's why the FOMC will likely cut rates tomorrow - but it hasn't been terrible either. On the downside, home sales/permits and manufacturing have been weak; on the upside, employment and consumption have been strong.
The LEI, which weighs all of these and other data, is near its ATH from May. This index can fluctuate during an expansion but the final peak has been at least 7 months before the next recession in the past 50 years (from Doug Short).

But investors have responded to troubling economic news headlines by becoming exceptionally bullish on the safety of bonds, meaning they expect bond prices to rise further (and yields to fall further; from Jim Bianco).

The last 3 times sentiment was this extreme, treasury yields rose very strongly (arrows)...

... and SPX also rose (arrows).

10 year yields need to exceed 2.2% (the June high and the 50-dma, blue line) to have a clear bottoming pattern.


If you find this post to be valuable, consider visiting a few of our sponsors who have offers that might be relevant to you.