Sunday, January 31, 2016

Weekly Market Summary

Summary: A more than 20% rebound in oil the past 10 days helped equities close higher a second week in a row. Importantly, there were two positive breadth thrusts this week: equities have strong tendency to add to gains over the following weeks. Despite equity's gains, investors remain very bearish, and this is also a tailwind into February. After a powerful move Friday, a giveback early in the week would be unsurprising.

* * *

US equities rose for a second week in a row.  SPY was up 1.7%, the Dow was up 2.3%. In contrast, NDX was up just 0.5%.

The biggest winner was once again oil, which rose more than 4% this week. Since it's low 10 days ago, oil has risen more than 20%. There is little doubt that this has had an outsized positive affect on US equities.

The longer term technical picture remains bearish for SPX. It made a lower high in November and a lower low in January. The 20-wma (blue line) is sloped downward, as it was in 2008 but also in 2010 and 2011. The pattern is bearish until SPX at least exceeds the prior high in November (2120 area): this is what separates 2008 from 2010 and 2011 (horizontal lines).


Saturday, January 23, 2016

Weekly Market Summary

Summary:  Equities fell to their August/September lows this week and then reversed higher. A retest of the low would be normal, something to keep in mind in the event of an uncorrected rise from here. Any number of breadth and sentiment indicators strongly suggest that prices should rise further in the weeks ahead. The risk comes from oil prices, which remain too volatile to predict and which have been highly correlated to equities for several weeks.

* * *

After falling 3 weeks in a row, US indices closed higher. SPY and RUT gained 1.4% and the leader, NDX, gained 3%.

Equities continue to follow oil, and oil closed the week 5% higher. During the course of most days, the correlation between oil and SPY has been uncanny, with the two making daily highs and lows within minutes of each other. This relationship will eventually fade, but for now it remains the main storyline in the markets.


Wednesday, January 20, 2016

Fund Managers' Current Asset Allocation - January

Summary: Fund managers' cash in January rose to the third highest level since the bear market low in 2009. This is bullish for equities.

Global allocations to equities dropped in half in the past month. Since 2009, equity allocations have only been lower in mid-2010, mid-2011, mid-2012 and mid-2015; all of these periods were notable lows for equity prices during this bull market. This is bullish for equities.

Allocations to US equities remain near an 8 year low, a level from which the US should continue to outperform as it has during the past 9 months. Europe remains very overweight. Emerging markets are near a record underweight.

Among sectors, exposure to industrials fell to the lowest level since mid-2012 and mid-2011.  From a contrarian perspective, the sector may be set up to outperform.

* * *

Among the various ways of measuring investor sentiment, the BAML survey of global fund managers is one of the better as the results reflect how managers are allocated in various asset classes. These managers oversee a combined $600b in assets.

The data should be viewed mostly from a contrarian perspective; that is, when equities fall in price, allocations to cash go higher and allocations to equities go lower as investors become bearish, setting up a buy signal. When prices rise, the opposite occurs, setting up a sell signal. We did a recap of this pattern in December 2014 (post).

Let's review the highlights from the past month.

Fund managers cash levels jumped to 5.4%, the third highest level since 2009. Cash has been over 5% six of the past seven months, the first time it has been this high for this long since late-2008 and early-2009. Current levels are an extreme that is normally very bullish for equities. Similar periods were market lows in mid-2010, mid-2011 and mid-2015.


Tuesday, January 19, 2016

Recessions And Bear Markets

Summary: Bear markets rarely take place outside of an economic recession. In the post-World War II era, only two bear markets have occurred outside a recession. The first (1966) occurred amid rapidly rising interest rates. The second (1987) occurred after a euphoric 50% rise in equities over a 10-month period. For what it is worth, the current market and economic environment is nothing like either of these situations.

* * *

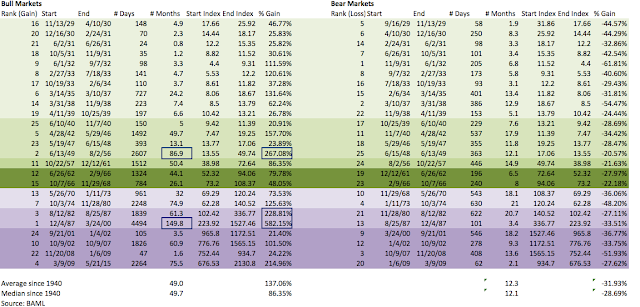
The commonly accepted definition of a bear market is a loss of more than 20% in the stock market index. Yes, 20% is an arbitrary number but so are 15% and 25%. For better or worse, 20% is the accepted benchmark.

Since the end of World War II, there have been 10 bear markets (see note below). Only 2 bear markets have occurred outside of an economic recession: 1966 and 1987.

The simple fact is that equity bear markets almost always take place within the context of an economic decline. This fact should not be surprising: declining employment and consumption typically leads to declining sales and profits for companies. Add in the propensity of equity valuations to fall when consumers are feeling gloomy and you have the basic recipe for a bear market.


Monday, January 18, 2016

Weekly Market Summary

Summary: US equities have dropped some 10% in the past two weeks, returning to their August/September lows. This has triggered a bearish technical pattern. Is the stock market signaling a recession and the start of a bear market? Risk has clearly increased, but on balance, the evidence suggests the answer remains no.

* * *

It was another week of steep selling: SPY lost 2%, NDX lost 3% and RUT lost nearly 4%. Small caps are still leading to the downside, with large caps holding up the best.

The biggest loser continues to be oil. After losing 11% last week it fell another 10% this week. This is not a sideshow. Oil and equities are usually, but not always, correlated. Between 1985 and 2000, the relationship was muddled and inconsistent; since 2000, however, oil and equities have moved mostly in the same direction (more on this here).

For the time being, the correlation between oil (red line) and equities (blue line) is unusually tight. It's a fair guess that equities will have a hard time rising until oil stabilizes or an event occurs that supersedes this relationship.


Sunday, January 10, 2016

Weekly Market Summary

Summary: Momentum should carry equities lower, at least intra-week. Important support levels have been broken; these are now first resistance. Breadth is washed out, similar to past lows, and investor sentiment is now very bearish. It's time to be on the lookout for the formation of a base and at least a temporary bounce higher.

  * * *

2016 is off to rough start. In fact, equities have never had a worse start to the year than they have so far in 2016. For the week, SPX fell 6%. NDX and Europe both fell 7%. Volatility (VIX) rose nearly 50% to its highest weekly close since the August low in equities.

Choose whatever narrative you like for the fall in equities: rate hikes, China, oil or valuations. For the week, oil fell 11% to its lowest level in more than 10 years. This certainly contributed to the pressure on equities.

That equites fell more than 5% is not that surprising. In our final post of 2015, we warned that US equities have sold off by more than 5% after each of the last 4 rate hike cycles began (read: If Santa Comes, Fade Him).

But, while the sell off itself is not atypical, the speed with which it has taken place has been astounding. 6% falls in one week are relatively rare. Outside of the depths of the 2008-09 bear market, falls like the past week have happened only 5 other times in the past 10 years.


Friday, January 8, 2016

January Macro Update: Equity Weakness Not Reflected in the Economy

SummaryThe balance of the macro data from the past month continues to be positive. To be sure, growth remains slow, but the balance of evidence suggests the imminent onset of a recession is unlikely.
    The main positives are in employment, consumption growth and housing:
    • Employment growth is close to the best since the 1990s, with an average monthly gain of 220,000 during the past year.  
    • Compensation growth is the highest in more than 6 years: 2.5% yoy in December.
    • Most measures of demand show 3-4% nominal growth. Personal consumption growth the last fours quarters has been the highest in 8 years.  
    • New housing sales, starts and permits remain near an 8 year high
    The main negatives are concentrated in the manufacturing sector:
    • Core durable goods growth fell 5% yoy in November. It was weak during the winter and there has been little rebound since. Industrial production has also been weak, falling -1.2% yoy. 
    • The core inflation rate remains under 2%, but note that CPI is beginning to tick higher.
    Prior macro posts from the past year are here.

    * * *

    Our key message over the past 2 years has been that (a) growth is positive but modest, in the range of ~3-4% (nominal), and; (b) current growth is lower than in prior periods of economic expansion and a return to 1980s or 1990s style growth does not appear likely.

    Modest growth should not be a surprise. This is the typical pattern in the years following a financial crisis like the one experienced in 2008-09.

    This is germane to equity markets in that macro growth drives corporate revenue, profit expansion and valuation levels. The saying that "the stock market is not the economy" is true on a day to day or even month to month basis, but over time these two move together. When they diverge, it is normally a function of emotion, whether measured in valuation premiums/discounts or sentiment extremes.


    Let's review each of these points in turn. We'll focus on four macro categories: labor market, inflation, end-demand and housing.


    Employment and Wages

    The December non-farm payroll was 292,000 new employees plus 50,000 in revisions. In the past 12 months, the average gain in employment was 220,000. Gains in 2014 and 2015 are the highest since the 1990s.

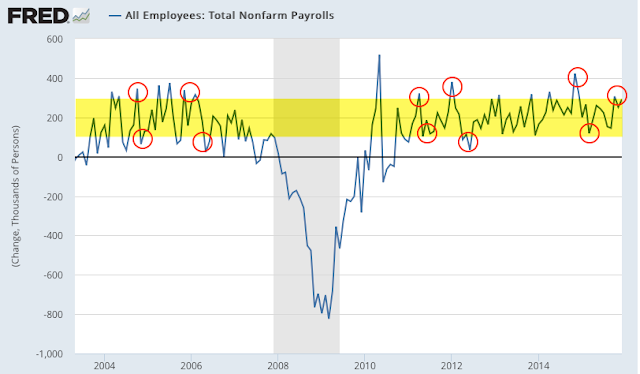
    Monthly NFP prints are normally volatile. Since 2004, NFP prints near 300,000 have been followed by ones near or under 100,000. That has been a pattern during every bull market; NFP was negative in 1993, 1995, 1996 and 1997. The low print of 119,000 in March, as well as the 'disappointingly weak' print in September, fit the historical pattern. This is normal, not unusual or unexpected.