* * *
Equities ended the week higher: SPY and DJIA rose 1% and NDX rose over 3%. Outside the US, Europe gained 1% and EEM gained 3%. The biggest mover was oil, which gained 12%.
The last two weeks have been remarkable. On August 17, SPY closed less than 1% from its all-time closing high. A week later it had lost 11%. And then three days later it had regained half of those loses, jumping 6%.
A drop that much, that quickly, is very rare. According to David Bianco, it has happened only 9 times in the more than 20,000 trading days in the past 80 years. All of these occurrences were precipitated by (perceived or real) political or economic crises.

That was the case now as well. Since the Chinese Yuan depreciation began through the low in equities on Monday, 92% of the fall in SPY occurred overnight. Cash hours were nearly flat. The fall in equities had very little to do with domestic earnings or economic reports. It was a reaction to events overseas.
Our view has been that the Yuan depreciation (just 3% to date) is unlikely to have a long lasting affect on the US stock market or its fundamentals. Exports to China account for less than 1% of US GDP. Only 2% of revenues for S&P companies is directly derived from China (data from Barrons).

Moreover, the current situation is nothing like the Asian financial crisis in 1997. We detailed this last week with the conclusion that even that far more significant event had limited impact on US equities (read more here). There has as yet been no spillover to other currencies (data from the WSJ).

Our bottomline is that the fall in equity prices, which has knocked investor sentiment to its knees, opens up an attractive risk/reward opportunity for investors. Further weakness, which is quite possible, is an opportunity to accumulate with an eye toward year-end.
Volatility will likely remain elevated for several months. Waterfall events like these tend to most often reverberate many weeks ahead. Price will often jump 10% or more higher and also attempt to retest the lows. Investors that have become accustomed to smooth conditions should be forewarned.
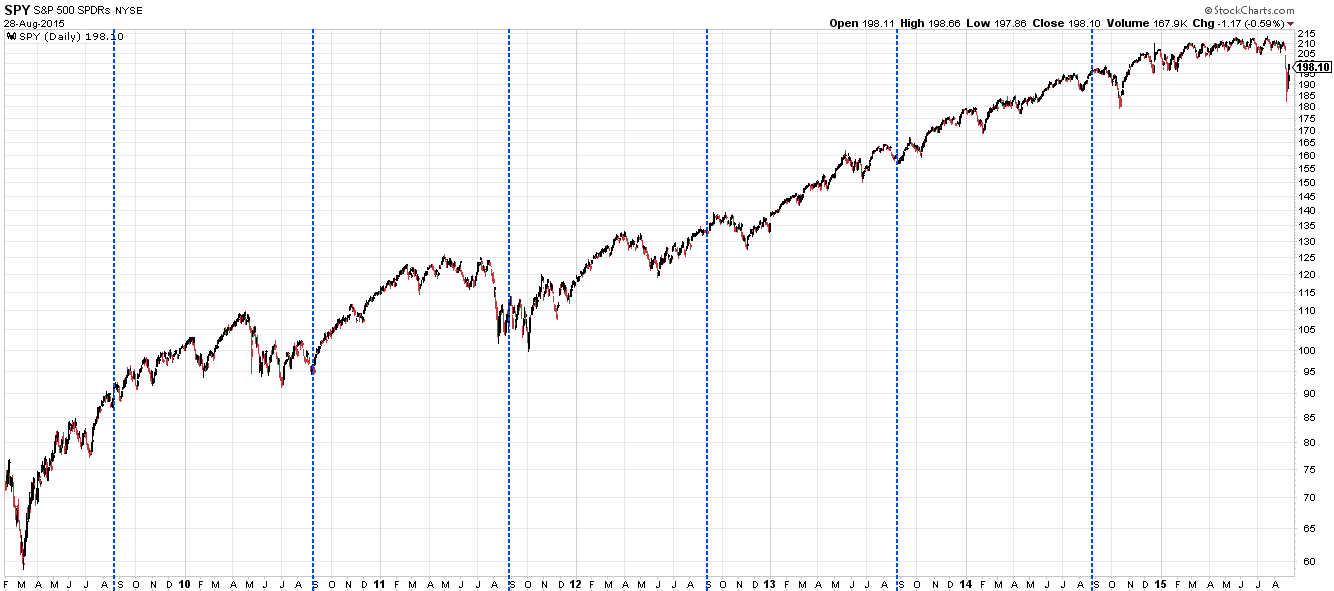
Let's look at previous similarly quick falls in SPY.
In 1997 (left side of the chart), a 14% fall in SPY was quickly reversed. The low was never retested but SPY struggled for several weeks after its initial bounce. It gained almost 20% six weeks after the low but after 3 months it had given back half those gains and had really not progressed far. Note first resistance at the point where the plunge took place (arrow).

In 1998 (right side of chart above), SPY also hit first resistance at levels where investors had been trapped by the swift fall (horizontal lines). The first low was retested in the next week and next month. In between, SPY rallied 13%. The first low was largely the extent of the downside.
2011 was similar to 1998; both declines were more severe than now and both recoveries were slow. Like 1998, the lows were retested in the next week and next month. Again, note the first resistance where investors were left surprised and eager to sell (arrow).

On their own, these prior instances are not definitive, but they do suggest that at least half of the initial bound in SPY off the low will likely be retraced in the next week or two and maybe again a few weeks later. A full retest of the low is also possible, near term and in the weeks ahead. The range will likely be wide and loose.
The open gaps in SPY are areas where investors woke up and found themselves trapped from the overnight fall; these are likely to be resistance levels: 202-204 and 206 (green). The area around 204 is likely to be particularly formidable, as this was also the bottom of a long trading range (yellow). A rally to 204 would equal 9% off the low. On the downside, filling the open gap at 194 would equal a 50% retrace of the initial bounce.

Based on the patterns from prior cases, a revisit to the lows, especially the first time, would be a high odds point to accumulate. Contrariwise, an uncorrected move to the 202-204 area in the next week or two would likely fail, with expectations that the lower end will be revisited before price moves substantially higher.
The most compelling evidence that a near low has been established is extreme equity outflows. Almost $30b left global equity funds over the past week, the largest outflow since BAML began tracking in 2002. $19b left equity funds on Tuesday alone, the largest single-day outflow since August 2007 (article).

In the chart above, large outflows in 2012 (May), 2013 (June) and 2014 (October) corresponded to durable lows in equities. In August 2007, SPY had dropped more than 10% (similar to now) in the course of a month. The large equity outflow marked the exact low (red arrow) and SPY was 12% higher two months later.

Note that at the August 2007 low, like now, SPY was under its 200-dma and it's 50-dma was declining. This was bearish price action; it looked to all like the bull market was over. In the event, it was not a smooth ride higher. More than half the initial bounce off the low was given back in September and it took 4 weeks for SPY to clear its 50-dma (blue arrow). But SPY went on to a new high nonetheless.
If this same price action occurs now, SPY could be trading between a high of 200-205 and a low of 190-195 until late September, and at new highs by Thanksgiving. That sounds unlikely to most now, but keep an open mind.
Similarly, flows into Rydex bearish funds and cash (lower panel) rose to one of the highest levels in nearly 10 years this week. Defensive moves like these have corresponded with lows in SPY during bull markets (data from Andrew Thrasher).

Many sentiment reports look similar to fund flows. Investors Intelligence bulls minus bears fell to 9.1% and NAAIM equity exposure fell to 28%. The chart below is from II; sentiment is at the equivalent level to June and November 2012 and also the August 2007 low referenced earlier (green lines). Perhaps it will sink further to below zero. Based on this, the low this week 'should' be close to a durable low, although one that may be retested.

An important point: sentiment turned quickly bullish after the August 2007 low. By October, sentiment had already become overly bullish again. The index peaked and fell into a bear market. This is in contrast to the period after the 2011 low. This is something to watch closely in the weeks ahead.
Forward returns in SPY over the next 3, 6 and 12 months are above average when II bulls minus bears is at current levels (arrow and highlight). In fact, lower sentiment doesn't improve returns over the next half year (data from Charlie Bilello).

Breadth is as washed out as sentiment. On Monday, the percent of DJIA stocks above their 50 or 200-dma was as low as on July 2, 2010 and August 10, 2011. That was the exact low in 2010 and a 2 month low in 2011.

In the Nasdaq, breadth has only twice in the past 15 years been more washed out than it was this week: near the end of the 2008 decline and at the 2011 low (green lines). Lows in the NDX have typically come when breath was less washed out than now (yellow). This week was an extreme sell off that typically sets up a new leg up in equities.

In the S&P, the percentage of stocks on Point and Figure buy signals (a measure of breadth) fell to one of the lowest levels in the past 20 years this week (green highlights). The bounces from the low in 1998 and 2011 might look small, but were ~10% both times. These lows were retested 1 and 2 months later, respectively. The other instances came during or at the bottom of a bear market. Assuming, as we do, that the bull market is ongoing, this week 'should' have marked a near low in equity prices.

VIX shot up over 50 this week. This is the highest level in 20 years outside of the 2008-09 meltdown. Clearly, fear levels were extreme. The more important point is that in each similar case during a bull market (highlighted) it took at least 2 months and sometimes as long as 6 months before VIX fell back under 20. This suggests that the coming weeks (and longer) will likely remain volatile; again, trading ranges will be wide and loose. A 10% move higher followed by a retest of the lows by the end of October is within that realm.

We see that prior cases where sentiment, breadth and volatility are similar to now have occurred in bear markets. Our firm belief is that the bull market is ongoing. We detailed this last week. In brief, bear markets begin either because sentiment reached an extreme or, more often, because economic data points to a contraction. Neither of these currently apply. Read further here.
US macro data continues to point to an expansion. Real GDP, final sales, GDI, retail sales and personal consumption are all growing about 2.5-3% yoy. Housing starts and sales are at 8 year highs. Railroad loadings are at all-time highs and trucking tonnage is near its recent highs. The overwhelming evidence is that the economy is in an expansion; there is not a compelling economic set up for a bear market (data from Yardeni).

The biggest weakness now is valuations: it is a valid point that valuations are not cheap. Even after the sell off, P/Es on the S&P are about 7% above their long term average. Price to sales is closer to 20% above its average. If margins decline, which they have yet to do, earnings will grow slower than sales. Unless the economy starts growing faster than 2-3% (real), valuations could realistically restrain the upside potential of share prices. That doesn't have to equate to an equity decline, but upside expectations should probably be kept in check (data from FactSet).

Stability in crude would likely help calm equity markets (fear of HY defaults) and improve corporate financials (the fall in oil is the primary culprit behind flat EPS and sales in the past year). Crude prices fell 60% until March, then rose 50% to June before falling 40% into August. We have detailed this pattern before (here). The 12% rise in crude this week reversed the prior 3 week decline. The first reaction will likely come at its falling 50-dma near $50 (arrows). The 50-dma needs to flatten out before a more sustained uptrend becomes likely.

September begins on Tuesday. Over many different time periods, September has usually been a poor month for equities. This would fit with a pattern where equities now work off the extremes in downward momentum over the next month (data from Bespoke).

Equities perform well in the first half of the month; it's the latter half which has been weak, something to keep in mind should SPY rally without much of a retrace in the next week or two (data from Almanac Trader).

This roughly fits the pattern around Labor Day: SPY is normally strong leading into the holiday (which is next weekend) but turns neutral the week after (data from SentimentTrader).

The Fed holds its annual meeting at Jackson Hole this weekend. It has marked lows and near tops in the past 6 years. There's no solid edge either way.
Economic reports next week are dominated by non-farm payrolls on Friday.
In summary: It's never perfect in equity markets; when price patterns and breadth look healthy, sentiment is overly bullish and further appreciation becomes limited. When price falls, the price pattern looks scary and breadth looks terrible but sentiment becomes too bearish. These are when longer term lows form. More likely than not, that is where equity markets are now.
Our weekly summary table follows:

If you find this post to be valuable, consider visiting a few of our sponsors who have offers that might be relevant to you.