* * *
Over the past year, the S&P index is up 7%, the Nasdaq 100 is up 14% and the Russell 2000 is up 6%. Since the start of 2015, those gains are 1%, 7% and 0%, respectively.
With a choppy trading range so far in 2015, are the indices hiding widespread carnage under the surface? In other words, have most stocks fallen hard and their losses hidden by a few winners? The short answer is no.
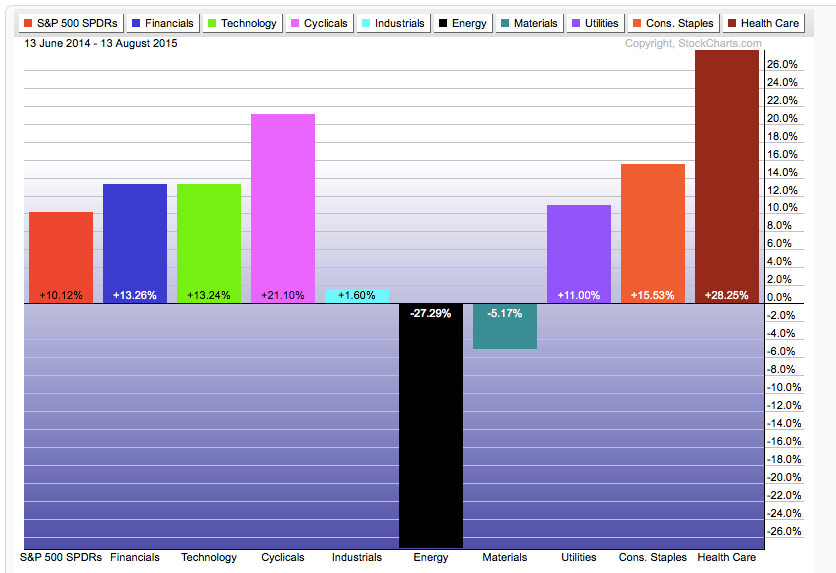
To be clear, some sectors have been hard hit. From their highs, energy companies have fallen an average of 25%. Material stocks have fallen an average of 15%. And clearly small cap companies in the Russell have been much harder hit than large cap stocks in the other indices.
But other stocks have gained, especially in the healthcare, consumer discretionary and financial sectors. So how have stocks performed on average?
Most stock indices are weighted by market capitalization, so larger companies have a disproportionate influence on the index's gains and losses. By looking at equal-weighted indices, in which every company has the same influence, we can see how an average stock has performed.
Starting with the S&P, the average stock is up 6% in the past year and flat for 2015. Since their 52-week high, the average stock is down just 3%. Keep in mind, the average stock in the S&P has risen 80% in the past 3 years.

The average stock in the Nasdaq 100 is up 14% in the past year and up 3% in 2015. Since their 52-week high, the average stock is down just 3%. For perspective, the average stock in the Nasdaq has doubled in the past 3 years.

The average stock in the Russell 2000 is up 5% in the past year but down 3% in 2015. Since their 52-week high, the average company is down 9%. While this is sizable, keep in mind the average small cap stock has risen 80% in the past 3 years.

For the S&P and the Nasdaq, the average stock is higher over the past year and not far off their 52-week highs. Small caps have been harder hit recently, but are only down a small amount so far in 2015. Any recent loss comes after stocks have, on average, risen more than 80% in the past 3 years. During the course of nearly every year since 1980, the S&P has dropped more than 7%. There is nothing unusual taking place, so far at least.
It should be noted that investors have the vast majority of their money in the S&P and the Nasdaq and comparatively little in the high volatility Russell.

It's not clear that looking at the average stock's performance is more representative of the rise or fall of investors' portfolios than looking at market capitalization weighted indices. Investors hold a disproportionate amount of large companies, not an average of all companies.
Have certain sectors seen 'carnage'? Absolutely. Oil prices peaked in June 2014. The dollar has also appreciated considerably in that time, hurting commodities. In those months, the energy and material sectors are down. But all the other sectors are flat or higher.
The bottomline is this: some companies are doing well, and some are doing less well. On average, stocks are higher over the past year and are not far off their 52-week highs. There's no carnage being hidden by the indices.
If you find this post to be valuable, consider visiting a few of our sponsors who have offers that might be relevant to you.