Sunday, August 21, 2016

Weekly Market Summary

Summary: Resilient macro economic data as well as healthy consumer and corporate balance sheets provide a bullish longer term back drop for US equities. While the indices traded at new all-time highs this week, the pace of the advance has markedly slowed. The S&P has effectively reached the 2200 "round number" milestone and some shorter term measures of investor sentiment show bullishness at their highest level since the end of 2014. There's been no price trigger, but a set up for a retrace of some of gains since June is in place.

* * *

At our last market summary at the end of July, the S&P had closed at 2173. In the three weeks since, the index has gained just 10 points, or 0.5%. In the last two weeks, the index has gained exactly 1 point.

Almost all of the gains in the past three weeks came on August 5th, the day when non-farm payrolls were better than expected. The S&P gained nearly 1% that day and has done little since.

Our view has been that US equities are most likely in a final "wave 5" of their 7 year bull market, supported by solid breadth, skeptical long term sentiment and continued macro expansion. That view continues to be validated: SPX, NDX and DJIA all made new ATHs this week, and RUT made a new 1-year high. The trend remains higher. A recent post on this is here.

Strong gains in July are often partially retraced in August and September, months that are seasonally weak and also susceptible to increased volatility. That has so far not been the case: volatility has been persistently low and the indices continue to grind higher. This is why we always distinguish between a "set-up" for prices to move up or down and a "trigger" to indicate that the expected set-up has been activated.

The S&P remains above all its moving averages. With little gain over the past two weeks, it's not surprising that the 5-dma has flattened and the 13-ema is just below it. The likely "trigger" for a retrace will be the 13-ema inflecting lower. It's not perfect, but a when the MACD is declining (lower panel), RSI is under 50 (upper panel) and the 13-ema has inflected lower (lowest panel), a drop in the S&P is usually underway. Right now, only the MACD is weak; RSI and 13-ema are close to confirming, but haven't yet (enlarge any image by clicking on it).

Tuesday, August 16, 2016

Fund Managers' Current Asset Allocation - August

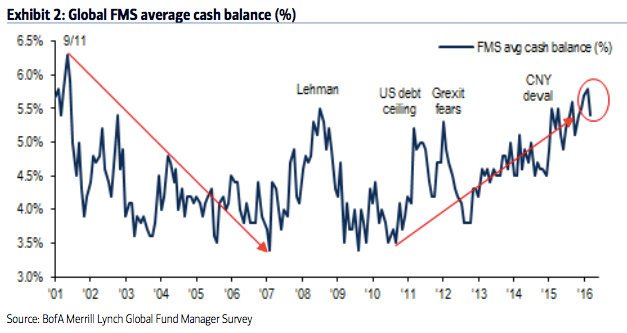
Summary: Since February, US equities have risen more than 20%. Equities outside the US have risen 16%. A tailwind for this rally has been the bearish positioning of investors, with fund managers' cash in February at the highest level since 2001. Similarly, their equity allocations in February had only been lower in mid-2011 and mid-2012, periods which were notable lows for equity prices during this bull market.

Remarkably, allocations to cash in July were even higher than in February, and fund managers became underweight equities for the first time in 4 years. Investors dove into the safety of bonds, with allocations rising to a 3 1/2 year high in June and July.

Now in August, cash allocations are only slightly lower than in February and allocations to equities only slightly higher. Both are about one standard deviation away from their long term mean. Overall, fund managers' defensive positioning supports higher equity prices in the month(s) ahead.

Allocations to US equities had been near 8-year lows over the past year and half, during which the US has outperformed most of the world. That has now changed: exposure to the US is at a 20-month high. There is room for exposure to move higher, but the tailwind for the US due to excessive bearish sentiment has mostly passed. That's also the case for emerging markets which have been the best performing equity region so far in 2016.  European equity markets, which have been the consensus overweight and also the world's worst performing region, are now the contrarian long trade within equities.

* * *

Among the various ways of measuring investor sentiment, the BAML survey of global fund managers is one of the better as the results reflect how managers are allocated in various asset classes. These managers oversee a combined $600b in assets.

The data should be viewed mostly from a contrarian perspective; that is, when equities fall in price, allocations to cash go higher and allocations to equities go lower as investors become bearish, setting up a buy signal. When prices rise, the opposite occurs, setting up a sell signal. We did a recap of this pattern in December 2014 (post).

Let's review the highlights from the past month.

Cash: Fund managers cash levels at the equity low in February were 5.6%, the highest since the post-9/11 panic in November 2001 and lower than at any time during the 2008-09 bear market. This was an extreme that has normally been very bullish for equities. Remarkably, with the SPX 20% higher, cash in July was even higher (5.8%) and at the highest level in 14 years (since November 2001).  That has moderated only slightly in August, falling to 5.4%. High cash levels are supportive of further gains in equities in the month(s) ahead (enlarge any image by clicking on it).


Tuesday, August 9, 2016

Be On Alert For A Pop Higher in Volatility

Summary: The trend in equities continues to be higher, even a very short term basis. As equity prices move higher, volatility is compressing. That, on its own, is not bearish, as volatility can stay low for months as equities grind higher. But it's noteworthy that volatility has popped higher in each of the past seven Augusts. Combined with an unusually tight trading range in SPX and an extreme in the volatility term structure, short term traders should be on alert for a pop higher in volatility. That may well correspond with SPX approaching its next "round number" milestone at 2200.

* * *

This week, the major US equity indices - SPX, NDX and COMPQ - all traded at new bull market highs. Moreover, RUT has traded at a new 12-month high. None of these, nor the DJIA, has closed below its 50-dma since late June. All are trading above their rising 5, 10, 20 and 50-dmas. The trend for US equities remains higher, even on a very short term basis.

As always, the first sign of a weakening trend will be consecutive closes below the 5-dma, which will then flatten or inflect downwards. As of today, that is not the case for any of the US equity indices.

In our last update, we shared several studies related to trend, breadth, sentiment, macro and corporate reports that supported higher equity prices in the month(s) ahead. That continues to be the case. Read that post here.

But there were also reasons to be on alert for a retracement of recent gains in August.  This post elaborates further on some of these reasons with a focus on volatility.

The CBOE volatility index, Vix, which measures implied volatility in the stock market over the next month, has been under 12 the last 4 days and also intermittently under 12 over the past month. This is unusually low volatility.

On its own, a very low Vix is not necessarily bearish: forward returns in the SPX are no different than when the Vix is above its median of 18.6 (data from Mark Hulbert).


Friday, August 5, 2016

August Macro Update: New Post-Crisis Highs in Employment, Wage Growth, Income, Consumption and Housing

SummaryThe macro data from the past month continues to mostly point to positive growth. On balance, the evidence suggests the imminent onset of a recession is unlikely.

Overall, the main positives from the recent data are in employment, consumption growth and housing:
  • Monthly employment gains have averaged more than 200,000 during the past year, with annual growth of 1.7% yoy.  Full-time employment is leading.
  • Recent compensation growth is the highest in 7 years: 2.6% yoy in July. 
  • Most measures of demand show 3-4% nominal growth. Real personal consumption growth in 2Q was 2.7%.  Retail sales reached a new all-time high in June.
  • Housing sales are at a new 8 year high. Starts and permits in June remain near their 8 year highs.
  • The core inflation rate has remained above 2% since November 2015.
The main negatives are concentrated in the manufacturing sector (which accounts for just 10% of GDP):
  • Core durable goods growth fell -3.3% yoy in June. It was weak during the winter of 2015 and it has not rebounded since. 
  • Industrial production has also been weak, falling -0.7% yoy due to weakness in mining (oil and coal). The manufacturing component grew +0.6% yoy.
Prior macro posts from the past year are here.

* * *

Our key message over the past 2 years has been that (a) growth is positive but slow, in the range of ~3-4% (nominal), and; (b) current growth is lower than in prior periods of economic expansion and a return to 1980s or 1990s style growth does not appear likely.

Modest growth should not be a surprise. This is the typical pattern in the years following a financial crisis like the one experienced in 2008-09.

This is germane to equity markets in that macro growth drives corporate revenue, profit expansion and valuation levels. The saying that "the stock market is not the economy" is true on a day to day or even month to month basis, but over time these two move together. When they diverge, it is normally a function of emotion, whether measured in valuation premiums/discounts or sentiment extremes.


A valuable post on using macro data to improve trend following investment strategies can be found here.

Let's review each of these points in turn. We'll focus on four macro categories: labor market, inflation, end-demand and housing.


Employment and Wages

The July non-farm payroll was 255,000 new employees plus 18,000 in revisions.

In the past 12 months, the average gain in employment was 205,000.

Monthly NFP prints are normally volatile. Since 2004, NFP prints near 300,000 have been followed by ones near or under 100,000. That has been a pattern during every bull market; NFP was negative in 1993, 1995, 1996 and 1997. The low print of 84,000 in March 2015 and 24,000 in May 2016 fit the historical pattern. This is normal, not unusual or unexpected.