
The lack of breadth has been a widely cited concern. New all-time highs have been met with only about 10% of SPX companies making even 52-week highs. In one respect, however, breadth is healthy: in May, every sector except utilities was higher, many by nearly an equal amount to SPX (2%).

Next week, SPX will surpass the 1995-96 record for number of consecutive days in which the index has traded above its 200-dma. These streaks normally last less than 300 days; the current one is already much longer, at 385 days (click for a list from Chad Gassaway).
It's fair to say that long streaks like these normally take place either at the beginning (1982, 1992, 2003) or end (1980, 1987, 2007) of a bull market. This makes sense: bull markets are born in gloom and die in euphoria. 1996 and (so far) 2014 are exceptions, coming in the middle of a bull market.
Technically, the 2014 and 1996 periods are similar, a topic we covered recently (post). Both followed years where SPX rose about 40%. And both started the year with a 3-month period of sideways trading. Should SPX continue to move higher in June, they will share yet another similarity as that is how 1996 unfolded as well.

While it's convenient to think of 1996 as an example of how long markets can continue higher, in important ways that period bears little resemblance to today.
First, sentiment was nowhere near current levels. Despite the run higher in the index, there were more bears than bulls in late 1995. Even by mid-1996, bulls outnumbered bears by just 2 times. In comparison, that figure once again moved above 4 times this week. It hasn't been below zero since 2011. In the past, this level of excessive bullish sentiment has preceded a prolonged move sideways or lower (yellow lines).

Second, demand growth was about twice current levels in the mid-1990s. This week's revised "real final sales" figures (GDP less changes in inventories) showed growth of 2% in the past year. It's been in a 2-3% range for several years; in comparison, growth was 3-5% in the 1990s and 2000s.

By the same token, sales growth for SPX companies has been much less than what investors have typically come to expect during a bull market (chart from FactSet).

Third, no matter how you measure it, valuations are considerably higher now than in 1995-96. The chart below looks at price to sales on a trailing basis. The current level of 1.7x has only been exceeded by the tech bubble; in 1996, it was still only about 1.2x.

Net, the market was much less expensive, much faster growing and far less euphoric in 1996 than it is today. A long streak above its 200-dma (that continued higher after a correction) was reasonable in 1996. The current one is odds-defying.
SPX is up about 60% since its last correction of 10% in mid-2012. Many investors are looking at the 1990s as an example of why this may not be so unusual. Are they right?
The short answer is no. The gains in the 1990s are legendary. What is forgotten is how they were achieved. It was not by a steady march higher like we have seen in the past two years. 7-12% (or more) corrections happened twice per year. The 200-dma was touched each year from 1996-2000. Multi-month periods of sideways trading, like March-May this year, were the norm.

Each of these periods of chop and the interspersed corrections reset investor sentiment in a way that hasn't happened in 2 years. Importantly, this is what created the impetus to move the market higher each year. If the current period is like the 1990s from a technical standpoint, this pattern should once again become dominant.
The Week Ahead
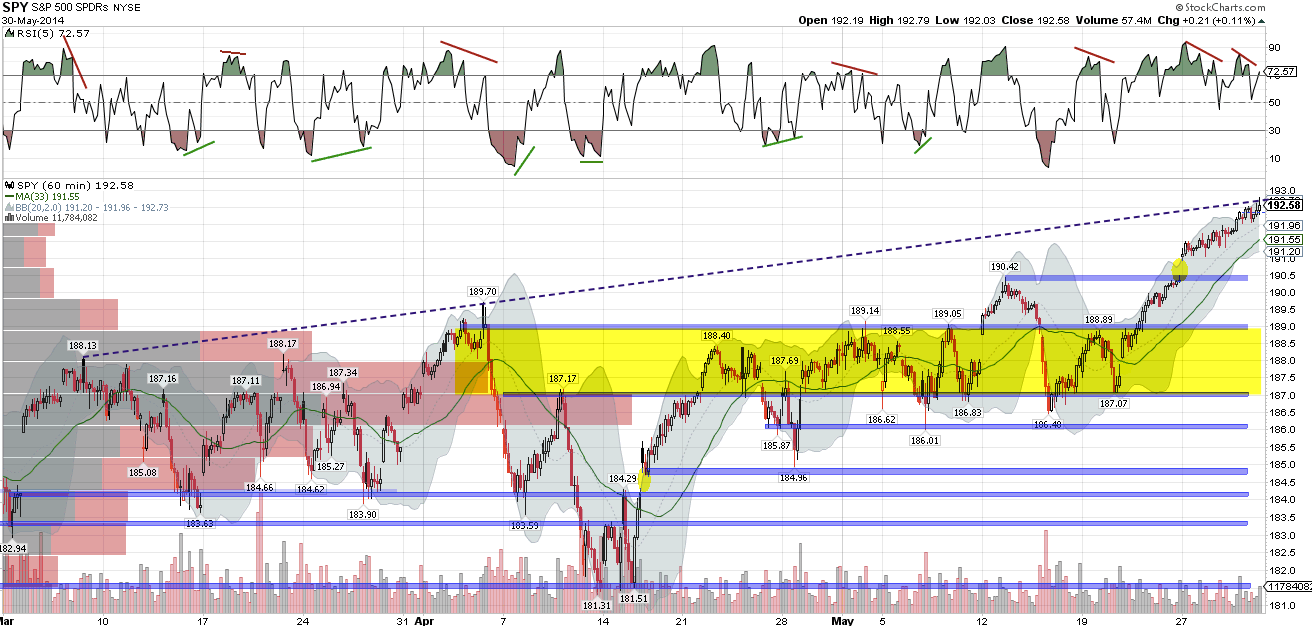
We expected SPY to encounter short-term resistance at last Friday's closing level of 190.4 (post). Instead, it gapped up $0.7 after the long weekend and ran higher the rest of the week. The 190 level now becomes first support, with a thick band of support lower, between 187-189. There is possible trend line resistance (March and April pivot highs) at Friday's close. Also note the negative RSI divergence at the closing high.
The daily chart remains healthy, a reminder to everyone (including us) that the longer timeframes matter most. SPY is above a rising 50-dma and 13-ema and within its channel. There is no negative divergence in RSI but it is overbought. For now, that implies a slower rate of gain.

One major watch out, however, is that SPY closed above its upper Bollinger 5 days in a row through Friday. SPY has only closed above its upper Bollinger 4 days in a row 4 times since 2009, each was followed by weakness (arrows). 3 of these 4 times were at or near significant tops in the market.

The same can be said for semiconductors. The recent pattern has mostly been weakness, at least short term, following a breach of its upper Bollinger. The trigger is a close back inside (Friday). The current set up is helped by price reaching early April resistance. Of special note is that semis are seasonally weak in June (click for a chart from Jack Damn).

NDX surmounted key 3620 resistance 10 days ago. It's 13-ema has been rising since; the trend is up. However, its now at double resistance formed by a broken one-year trend line (dashed) and the March top. In addition, RSI shows a loss of momentum with a negative RSI divergence. It should struggle here next week.

RUT has completed its backtest of its 50-dma, which we expected. Right now, it consolidating at the 50-dma, which is bullish (like December 2012, before going much higher; highlighted in yellow). The 50-dma is still trending down, so a move higher is counter the longer trend.

Unlike SPX, RUT recently ended its longest ever streak above its 200-dma. In the past after each prior streak ended, RUT has made a long pierce of its 200-dma or, more often, formed a long consolidation before making a sustained move higher. It has done neither so far, something to keep in mind in the weeks ahead (post).

June starts this week. The 'sell in May' meme gets its name due to weakness in June. Since 1950, DJIA has lost –1.9% and SPX –2.1%. The last 20 years have been even weaker. Moreover, SPX has been down in 11 of the last 16 midterm Junes (data from Stock Traders Almanac; chart from Bespoke).

Seasonal strength in RUT ends in June as well. It typically underperforms until December (chart from Stock Traders Almanac).

The first trading day of each month has also marked a directional turn in RUT over the past 8 months. A run higher into month end has reversed lower, and vice versa (from Stock Charts).

Nonetheless, June tends to start strong. Of special note is that Friday is NFP release day: SPX has been higher on 16 of the last 18 (chart from Sentimentrader).

Our weekly summary table follows.
