
It's not just that periods of low volatility tend to alternate with higher volatility, although this is certainly true. We looked at this topic in greater detail yesterday: the probability of a sharp rise in volatility over the next several weeks is more than 90% (post).
The implications of low volatility extend farther. Lewis Alexander, chief US economist for Nomura, in speaking to Myron Scholes, made this remark (article):
"The financial system responds to volatility. When volatility declines the natural tendency is to use more leverage and concentrate risk."This gets to the heart of the current market: an affinity for leverage and risk.
US household assets are now more concentrated in equities than at any other time in history aside from the late 1990s. Holdings are 50% above the mean and higher than during the bull market peaks in the 1960s, 1980s or 2000s (chart from J Lyons Fund Management).

Investors' affinity is not just for equities in general but for the highest beta equities. Before peaking in March, the rush to own small cap stocks pushed their price/sales ratio higher than it was in 2000.
Although the numbers are small on a relative basis, trading in penny stocks, the absolute riskiest corner of the equity market, has risen 40% in the past year to their highest level on record (from the WSJ).

The 10% drop in RUT and NDX since early March did little to dampen risk-seeking. The Investors Intelligence bull/bear ratio (3.1) has returned to the same level it was at the week of March 3 when NDX and RUT both peaked.
Assets in Rydex (retail investor) bull-oriented funds relative to bear or money market funds did not inflect down even slightly during the past two months; it is near a 14-year high. Not to be melodramatic, but the last time retail investors did not respond to a drop in equity prices was November 2007. When equity prices always seem to return to new highs, investors respond by maintaining full investment through downturns.

Risk seeking is half of the low volatility cocktail described by Lawrence. The other half is leverage.
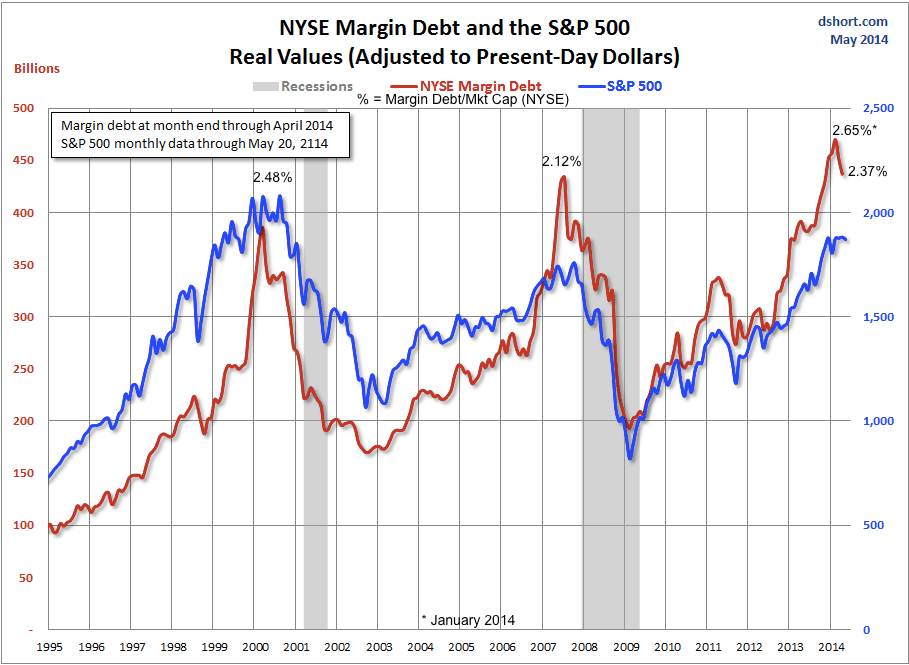
To chase the returns in equities, investors have deployed higher leverage than ever before. Margin debt earlier this year was higher than in either 2000 or 2007 on an absolute and relative basis (chart from Doug Short).
The heart of Lawrence's view on volatility is that risk concentration and leverage are pushed to a limit. Valuations, asset allocation and sentiment suggest that a risk limit may have been reached.
Leverage might have also reached a limit. In the chart above, leverage has declined by 6% in the past two months. The obvious prior examples are 2000 and 2007, when a decline in leverage preceded a decline in equity prices.
Even if those periods are extremes, declines in leverage also coincided with notable equity declines in 1998 and 2011. According to Sentimentrader, similar declines in leverage have led to an average 12% decline in equity prices over the next year, with returns negative 75% of the time.
Low volatility has muted the indicators we use to assess low and high pivots in the markets. NDX and RUT both corrected 10% in the past two months, yet consider all of the following:
- RUT has been below its 200-dma most of May but none of the other US indices have been even close to their 200-dma.
- None of the sentiment indicators have come close to showing a preponderance of bears.
- There hasn't been a major major distribution day (10:1 down volume) since February.
- Trin has not exceeded 2.5 and NYMO has not exceeded -50.
- Put/call has not exceeded 1.2 since October 2013.
- Vix hasn't exceeded 18 since February and has only spiked above its Bollinger twice since then.
Now take 1996 as a counter example. That year is similar in many ways to 2014, following the especially strong 1995 market (post). Into its July 1996 low:
- SPX lost 10% and traded below its 200-dma for more than a week.
- Investor Intelligence Bull/Bear ratio plunged under 1 (it's now 3.1).
- There were two major distribution days.
- Vix spiked 60% higher off its low, reaching 22 (it's now at a 7 year low).
That's a typical washout. We have not seen anything remotely close to this yet. If the low in the indices is behind us, it would be remarkable. It would be, in short, the mildest correction ever.
The Week Ahead
At the end of last week, TLT closed above its Bollinger band, a reliable indication of short term weakness. In the event, it traded down nearly 2% through Thursday.
At the same time, RUT ended last week with a positive divergence in its RSI and having held the critical 1090 support level. The risk/reward was attractive (post) and it gained 2% through Friday. Looking ahead, so long as that support area holds, we would continue to expect RUT to move higher and backtest its declining 50-dma. This is a countertrend move, but that is how many new legs start. Importantly, there is no longer any risk in this trade.

Seasonality will be a tailwind as it is generally favorable after Memorial Day and continues to be positive through the first week of June.


It took SPY seven tries but it finally closed above 189. The temptation is to say that closing back below 189 will constitute a failed breakout, but the reality is that it will just be back in the same trading zone (187-189) that it has occupied the past 5 weeks. That should be thick support.
We would expect consolidation or a retrace to start the week ahead. Note the negative RSI divergence at the prior pivot from mid-May on the hourly chart.

On the daily, note that SPY closed above its Bollinger band on Friday for just the third time in 2014. The other two times (April 2 and May 13) were followed by weakness (arrows).

Since it first crossed above 187 on March 4, SPX has moved sideways from the top of its rising channel. Should it get to the bottom rail (about 184), the first touch is likely to be a strong bounce, just as it was for RUT and NDX in early April. The 13-ema is rising; the trend remains up.
NDX performed in-line with RUT this week. It's now above the key 3620 area as well as it's 50-dma, areas we marked last week as being critical markers for trend. That 50-dma is still declining; in another week, it could start to rise, a bullish sign. It's 13-ema is also rising.

Breadth may have bottomed in NDX as well, moving higher off the 20% level that measures the percentage of its components above their 50-dma (bottom panel). This has marked prior lows. However, it's also been a fake-out; look closely at the false lows in both 2010 and 2011.

With SPX and DJIA near their prior highs and NDX above a key resistance area, US equities appear in some important ways to be getting healthier.
However, breadth is atrocious. NDX is just 2% off its recent high yet 69% of its companies are below their 50-dma. The index is masking a lot of weakness. SPX is above the highs on May 12-13 but the number of companies above their 50-dma is now fewer. That is the very definition of a negative divergence. On Friday, just 40% of SPX made even a 5 day high, 10% made a 50 day high and just 6% made a 1-year high.
We remain skeptical for the reasons given previously, but equities have slipped through more than one set of dire consequences in the past two years. The index price markers given above will be helpful in identifying an impending turn.
A final note, on the positive side, is that macro data relative to expectations has turned positive over the past two weeks, in both the US and in the G10. This was expected (post).

Our weekly summary table follows:
