The short story is this: SPY lost its 13-ema on January 23 at 182.8 (close) and hasn't been regained since. That's trend.
Here's the longer story.
The larger trend weakened further this week. In the US, the DJIA is now right on support from December; the other 3 US indices have held above. But ex-US indices all deteriorated further.

The same is true on the US sector level. Discretionary, energy and staples all broke support this week. Financials, industrials and semis are close to doing so as well. Meanwhile, there's been a strong flight to safety, with utilities and healthcare strongly outperforming.

The set-up in SPX now looks like this: 1770 (176.5 in SPY) was hit three times this week. A return there in the coming week is likely to lead to a failure and a drop to 1750 (support) or 1740 (channel from last March). From the Friday close, downside is 30-40 points.

As we pointed out last week, the first touch of the 50-d usually results in a back-test. In SPX, that level (1812) corresponds to the top horizontal line in the chart above, also the mid-December highs. That's 30 points above Friday's close. We still think that's likely so long as 1770 is not revisited. That set-up is therefore 3:1 positive reward/risk (+30 points to 1810 against -10 points to 1770).
On the daily chart, the current set-up looks similar to that of August. Note the position of RSI (top panel), MACD (middle) and %B (lower). Then, after 4 days below the 50-dma, SPX back tested it before establishing a lower low. That lower low, now, would be equivalent to 1740-50.

Among the telltale signs of a bottom we discussed last week, only NYMO confirmed, but barely. It closed twice at minus 50. Since 2009, prior to 2013, minus 80 was almost always reached at a durable low. The same was true during the 2002-07 bull market.

Trin has not exceeded 2 on this sell off and there has not been a second major distribution day after last Friday's. That's been the typical pattern.
Vix has spiked higher once. A second spike would also fit a recent pattern. To wit, Vix & More noted that Vix tends to decline post-FOMC (Wednesday) but then spike higher a week later. We'll be looking for this this week.

Lastly, we have been looking for put/call over 1.0; every low since 2009 has been marked by a close over 1.0; 75% of the time, it has closed over 1.2 at the low. The same was true during the 2002-07 bull market, with only one exception, in 2005. SPX continue higher but then formed a lower low (arrow). The 2005 market made no net upside progress from January until October.

The persistence of the low put/call (this is the longest streak under 1.0 since October 2004-March 2005) is in line with investor sentiment that remains excessively bullish despite a 4% sell-off. Let's review:
Investors Intelligence (advisors) was 38% this week after peaking 46% a month ago. After a long rise and a very high bullish reading, durable lows have been formed when the index closes below zero. There is still a long way to go.

NAAIM (active managers) exposure to equities fell from 95% last week to 71% this week (this is their net long exposure). Durable lows have been formed when the index closes below 35%. There is still a long way to go (chart from Short Side of Long).

Finally, AAII (retail investors) bullish percent reached 32% this week, after peaking at 55% a month ago. Durable lows are formed when the index closes below 25-30%. This is getting close (chart from Bespoke).


Small side note on AAII: it peaked at 55% in December and then moved lower as SPX moved higher into mid-January, i.e., they diverged. As you can see from the top chart, that is the normal pattern. For some reason, it's frequently misinterpreted that the initial move lower in the bullish percentage is positive; it's clearly not.
The modest correction so far has not dented global equity inflows, which have continued unabated this year, the longest stretch since 2007 (chart from ICI/Short Side of Long).

Finally, the latest margin debt figures for December were released this week. Margin debt has now made a new high. More importantly, margin debt as a percent of NYSE market capitalization is now 2.48%, higher than in 2007 and equal to 2000. Moreover, according to SentimenTrader, investor available cash (to invest) sank to a new all-time low, exceeding the extreme low in February 2000.
At a minimum, this indicates that the current 5 year cyclical bull market has reached late-stage maturity. The not-so-small risk is that downside can accelerate if investors reduce leverage (chart from Doug Short; percent of market cap data from blog author).

It's important to remember that the current downtrend has been in place only two weeks. Over the last two years, downtrends have been very short but also at least 5-9 weeks in length. Again, in 2005, the downtrend lasted most of the year. Time is important to reducing excessive bullishness (chart from Stock Charts).

SPX also has a pattern of regularly correcting to its lower weekly Bollinger Band (currently at 1682). Since 2009, the longest period between touches is 15 months; February marks 15 months since the last touch (chart from John Murphy). This is another reason to believe a longer correction is overdue.

Interestingly, in the 21 times that DJIA has lost the December low in 1Q of the next year (as it did this week), the index has gone on to lose a minimum of an additional 3.6%. If this is the case now, then DJIA will, in fact, decline to its lower weekly Bollinger in the weeks ahead. Moreover, the additional median decline has been 11%, which would take DJIA all the way back to its 2007 top, effectively making a back-test of the breakout in March 2013 (chart below from Stock Almanac).


November to January is the strongest three month stretch in the market. March and April are also typically strong. February is traditionally neutral. Its the pause month in a bullish period. That has been true over the past 20, 50 and 100 years (chart from Bespoke).

Most months start strong and then fade towards mid-month. February starts starts flat and then fades (chart from SentimenTrader).

Weakness in January doesn't improve returns in February. When January falls by more than 3% (like this year), February is also negative. But weakness in February, might well set up a solid return in March or April (chart from Stock Almanac).

Finally, the 4Q13 reporting period is half completed. The results so far are very good, with EPS growth of 7.9%. These results are skewed by financials; when they are excluded, EPS growth drops to 4.9%, which is comparable to expected FY13 EPS growth. Expectations for 1Q14 are dropping, however: EPS growth of 2.2% is expected (it had been 4.3% last month).
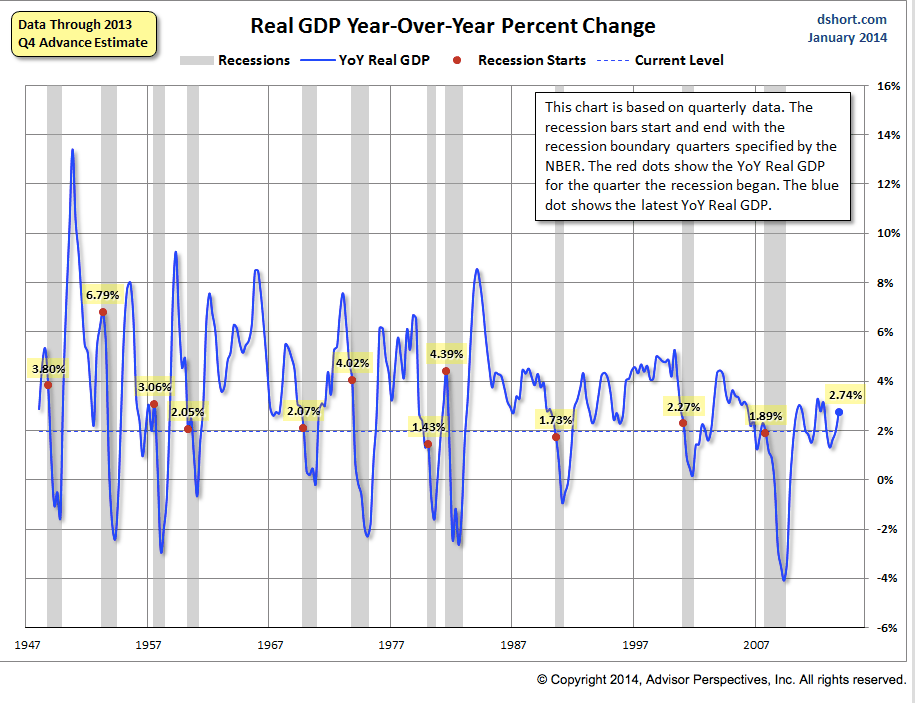
More interesting to us is sales growth. FY13 is tracking towards 2.0% growth; 1Q14 is expected to be 3.0% and FY14 is expected to be 3.8%. This is comparable to the latest GDP growth figures (2.7% real plus 1.1% core PCE equals about 4%; chart from Doug Short).
This points to FY14 EPS growth of 4-5% at the high end. Expectations are currently for 10%; that's unlikely. Growth in 2014 should be solid, but not spectacular. As we have said, with valuations full, the appreciation of stocks this year is likely to be paced by the growth in EPS (i.e., 4-5%).
Our summary table follows below:
