This week, SPY crossed above and then back below it's 13-ema (circles). This has been a pattern in 2013 (discussed last week) and it played out again this week. It came in conjunction with a second spike in the Vix Wednesday. The short term trend in SPY is down until the slope of the 13-ema reverses.

The short-term downtrend in SPY is confirmed by all 9 SPX sectors and all 4 of the US indices, all of which closed below their 20-dma this week. The longer term uptrend, as defined by the 50-dma, is still intact; none of these is yet below.
That is, it should be noted, quite in contrast to the rest of the world. Many ex-US markets are off more than 5% in the past few weeks. All World Ex-US index, Euro 350, DAX and Hang Seng are all below their 50-dma; FTSE, Australia's AORD and EEM are below their 200-dmas. To the degree this indicates growing global economic weakness, this is a major watch out for the US.

For the time being, the correction in US markets is contained. SPY ended the week right on support from last month. The short-term MACD is starting to curl upwards (circle). If this fails to hold, the 50-dma is a little over 1% lower.

Similarly, the Dow ended on support from late summer (arrows). It also breached its lower Bollinger (yellow shading) which has been close to recent correction bottoms in 2013.

Seasonality turns positive this week. This is the start of the annual Christmas rally when most of the December gains in the US markets take place. Monday is the 11th trading day of the month.

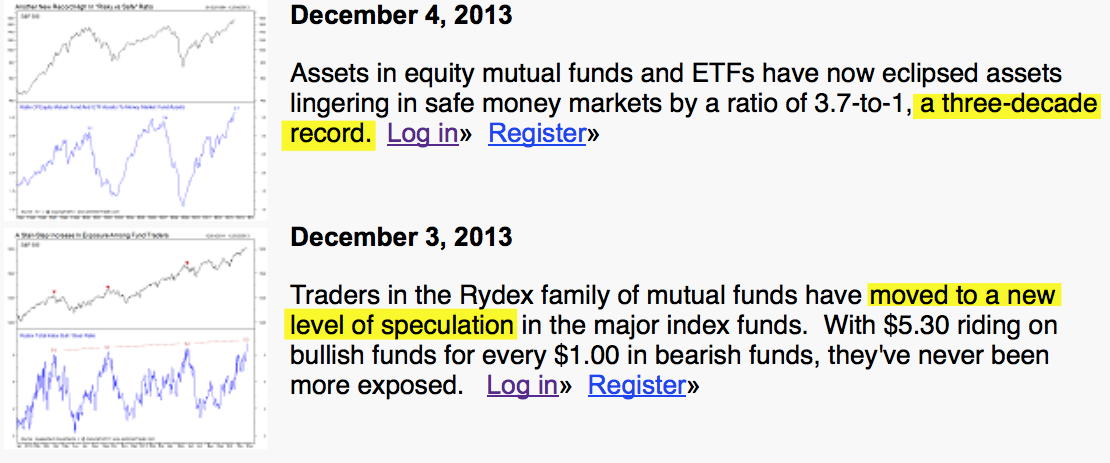
How far any bounce might take the indices is an open question. Sentiment has been red hot. Investors Intelligence bullishness is now in the top 96th percentile. Active money manager (NAAIM) equity exposure is at the highest level ever (here). There is no doubt that investors are at an extreme level of bullishness. It takes new money to fuel gains, but investors are already in the market.

Normally after a more than 2% correction and the start of a new uptrend, some extremes are seen in volatility, breadth or in the options markets. None of these have so far materialized. The conclusion is either that there is more downside ahead or, alternatively, that any seasonal bounce will be temporary.
Let's review this week relative to other lows in 2013.
In 2013, SPY has never put in a durable low without put/call closing above 1 (normally, above 1.3 is a good benchmark). This week's high was a paltry 0.79. Investors have been complacent.

TRIN normally spikes above 2 at least once. At the same time, there is either a 90% up volume day (middle panel) or a 90% down day (bottom panel) to mark, respectably, a momentum kick-off or capitulation. None of these three has yet occurred either.

There was a second volatility spike this week; in 2013, two spikes within a week has marked a low. But Vix never breached 16; prior bottoms this year have come with Vix over 18-20.

McClellan (NYMO) bottomed at minus 53 this week. We have seen some bottoms with NYMO at roughly this level, although the more longer lasting bottoms have occurred with NYMO under minus 80 or more.
Normally, the more shallow NYMO readings have come early in an uptrend (like this past winter), not late in a long uptrend. To see this, look at NYSI (Summation) in the lowest panel; a shallow dip in NYMO when NYSI is over 500 can be a bottom; when NYSI is close to zero (like now) a more extreme NYMO marks a bottom.

Net, these shallow readings in volatility, breadth and in the options market are consistent with excessive investor bullish sentiment. A spike in any of these in the weeks ahead would be a positive sign of a durable bottom.
On of our themes recently has been commodities. The CRB index has now outperformed SPX over the past two weeks by more than 300 bp. Seasonality for copper and oil turns bullish in December and sentiment for both is favorable. You can see that the CRB has reached an important resistance level (circles).

We also highlighted an inflection point in the dollar and Euro on Thursday (chart). If there is a trend change, it is early still.
Finally, 4Q13 earnings report do not begin for another month, but the downward revisions in expectations is the greatest on record. Earnings last quarter grew 3.4%; it had been left to 4Q to push FY13 growth to 7%. Now that 4Q is underway, estimates are being slashed from growth of 9.5% in September to 4.6%. We expect the same pattern to unfold in 2014 where the consensus currently expects 10% growth.

Our summary table below.
