* * *
US equities fell 4-5% last week. The nearly 10% gain in 2018 at the end of September for SPX has been reduced to just 3%. Small caps have been hit the hardest and are now barely above their level at the start of the year (table from alphatrends.net). Enlarge any chart by clicking on it.

Years with strong momentum and positive economic fundamentals, like 2018, have a strong propensity to continue higher to the end of the year.
But near-term (the next month) risk/reward is unfavorable and traders should be on alert for weakness.
It is unlikely that any equity weakness will be substantial or long lived.
Data supporting this view can be found here and here.
The bottom of the recent swoon may not be in but our view is that investors' bias should now be for higher prices in the weeks/months ahead.
That does not mean that investors should be complacent. At its low last week, SPX had retraced all of its gains from 3Q. You could, objectively, look at the August/September break out above the January all-time high (ATH) as having failed.
And here's the bad news: US equities have a topping pattern in place. Price weakens before it reverses. This is how tops are formed: there is a momentum high before an eventual price high as the uptrend falters. The momentum high for SPX was in January; in fact, momentum had not been higher in the past 40 years, a warning. Price eventually made new highs in August and September. This pattern is how every major top in the past 40 years has started. We wrote a post about this in August (here).

It's true that the lead time from momentum top to price top can as short as 3 months to as long as 5 years. So, on it's own, this doesn't suggest a major top is now occurring. But it was easier to brush aside the swoon earlier this year than the one occurring now. Risk is higher, greater vigilance is warranted.
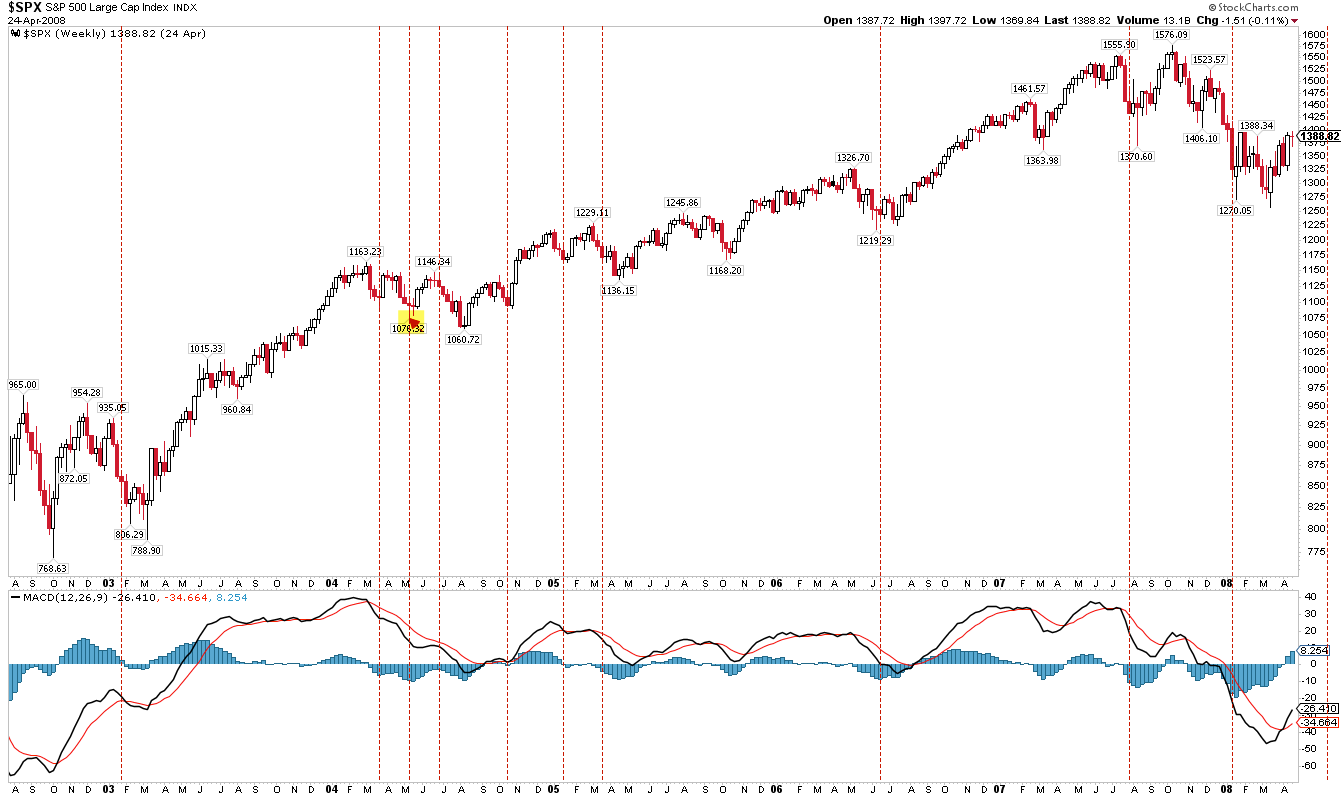
The current swoon is probably not over. SPX has fallen 3 weeks in a row, for the first time since June 2016. Since 2003, SPX has fallen 3 weeks in a row more than 20 times, and all eventually retested or exceeded the low, at least intra-week. This almost always occurs within the next 3 weeks but in 2004 and 2015 it took 6-7 weeks to occur (highlighted in yellow).

On further weakness, the late-May and late-June low near 2700 is key support. If that also fails, expect a full test of the 2018 lows near 2550. On strength, expect strong resistance near 2800 and then 2875.

As the recent downward momentum is worn off, we expect price to strongly rebound, probably to new highs. Why?
For one, the macro economic data shows the expansion remains robust. Many traders wrongly assume that equity price action leads macro fundamentals. In fact, employment, housing and consumption will weaken before the final equity top. That's one reason why the widely followed yield curve "inverts" ahead of the next recession and the ultimate cycle high in equities. Even the composite Leading Economic Indicator (LEI) has peaked a median of 3 months before SPX over the past 50 years; the most recent reading was at a new cycle high. Based on this, a significant equity peak before the end of 2018 is unlikely. A recent post on this is here.

Monday's retail sales report for September showed real growth of 2.4% yoy. Retail sales are at their second highest level ever; in comparison, the trend had clearly flattened well in advance of the two most recent recessions. That's the normal pattern.

If there is a growing concern, it is in the housing data: new home sales peaked 10 months ago. Combined with the equity topping pattern described earlier, and you have the outline for a looming top. Of some comfort is that housing nearly always peaks first, and a median of almost two years before equity markets. Based on this, an equity peak in mid-2019 is quite possible.
The second reason to expect a rebound in equities is upward momentum.
Before October, SPX had risen 6 months in a row. Going back 60 years, that has never marked a bull market top: SPX closed higher 3 months later (in this case, at year-end) 85% of the time by a median of 4%. The three failed instances closed higher within 6-12 months (from Steve Deppe).

Likewise, SPX closed higher in April, May, June, and July. In the 11 times this has happened since 1935, the index closed higher 5 months later (i.e., at year -end) every time by median of 12%. For reference, the July close was 2816, 2.2% higher from Monday's close (from Ryan Detrick).

And SPX gained 7% in 3Q. Since 1950, a strong 3Q has been followed by a strong 4Q every time except once (93%), with a median gain of 5%. The one failure closed higher by nearly 7% a year later (also from Ryan Detrick).

Third, it seems likely that breadth is near a washout that typically accompanies a low in equities.
Last week, less than 40% of SPX stocks traded above their 200-ema (bottom panel). That hasn't always marked the exact low - in several instances, there was a double bottom, highlighted in yellow - but risk/reward was clearly biased to the upside each time. That was also true during the 2003-07 bull market.

Likewise, more than 500 stocks on the NYSE hit a 1-year low last week. When SPX was in an uptrend (200-d rising) that has usually been near a washout low. Even the November 2007 breadth washout after SPX had peaked in October was followed by an 8% rally over the following month. A good warning of longer term trouble will be a second washout after a failed rally to new highs in the months ahead.

Breadth may not be indicating an exact low in equities - and it doesn't guarantee a notable top isn't beginning to form - but a strong rally is odds on.
Fourth, sentiment was also washed out last week, at least for the short-term.
Investors flooded into inverse ETFs (that bet on a further fall in equities), with relative volume hitting a record high. This has preceded strong equity rallies. Even in 2015 and earlier this year, SPX rose 12% and 7%, respectively, before rolling over (from Dana Lyons).

Likewise, the CNN Fear and Greed index dropped to an extreme of just 8, meaning investors had become exceedingly bearish. That has preceded a rise in SPX over the next month 86% of the time by an average of almost 4%, and 3 months later by an average rise of 6% ((from (from Sentimentrader; to become a subscriber, please use this link).

Part of the calculation in this index is volatility. By last Wednesday's close, VIX had more than doubled from the end of September. 1 month volatility is still trading at a premium to 3 month volatility, a condition that has only occurred near equity lows in the past 8 years, the last one being in early April before a 6 month rally.


Finally, all of this is occurring a month before the mid-term elections. Stocks have a strong tendency to bottom in mid-October and rally through year end (from Sentimentrader).

Over the final 3 months of the year during mid-elections, SPX has risen 20 of the last 22 times (91%; from Nautilus Research).

Over the 21 days prior to the last 9 mid-term elections, SPX has risen 8 times and lost a scant 0.6% once. This implies a close over 2884 (the close on October 8, 21 days before this year's election) by the election, nearly 5% above Monday's close (from OddStats).

The period after the mid-term election is also a strong tailwind for equities. SPX has been higher 6, 9 and 12 months later every time since 1950 (from Troy Bombardia).

So, while equities fell 4-5% last week and have given up most of their 2018 gains so far in October, this might feel like the start of a bear market, but that is the least likely outcome.
On the calendar this weeks: IP on Tuesday, housing starts and FOMC minutes on Wednesday and OpX on Friday. Next week is highlighted by new home sales on Tuesday and GDP on Thursday (from IBD Investors; for a trial subscription, please use this link).


If you find this post to be valuable, consider visiting a few of our sponsors who have offers that might be relevant to you.