After just two weeks, the SPX is already within 2% of Wall Street's year-end target. By at least one measure, momentum is at a more than 20 year high: in prior instances, short-term risk/reward has been poor but longer term returns positive. Sentiment, which is exceedingly bullish, has also most often led to positive returns 3-6 months later. Net, the longer-term outlook for equities remains favorable.
* * *
All of the US indices made new all time highs (ATHs) this week. This includes the very broad NYSE as well as the small cap index, RUT. For Dow Theorists, both the industrial sector and the transport sector made new ATHs this week. The dominant trend remains higher.
US markets are off to a fast start in 2018. SPX and DJIA are up 4% and NDX is up 5.5% (from Alphatrends). Enlarge any chart by clicking on it.

SPX closed Friday at 2786. Two weeks into the year, SPX is now just 2% from Wall Street strategists' year-end target of 2840 (from Barron's).

It isn't just the US that is rallying. In fact, the US is lagging Europe, Japan and emerging markets which are up even more (from Bespoke).

Breadth is excellent. Only the utilities sector is not making new highs. Over 80% of the SPX is trading above its 50-dma, the highest proportion since July 2016, a year and a half ago.

The push higher has SPX approaching 2800 "round number" resistance. SPX has a tendency to weaken as it nears each psychological level. Even during this forceful uptrend, the only down weeks recently have occurred near these round numbers.

The strong start to the year is probably due to several factors.
First, investors did well in 2017 and may be allocating new funds to equities in anticipation of further gains. Underperforming funds are no doubt especially keen to avoid another year of lagging performance.
Second, much of the corporate tax cut will likely to allocated to returning cash to investors. Walmart, for example, expects to allocate 70% to stock buybacks (from Bloomberg).

Third, the tax cut is estimated to add between 6-12 percentage points to 2018 profit growth. Already, earnings are being revised higher by the highest amount in more than 20 years (from FactSet).

Fourth, economic data continues to be both strong and better than expected. Retail sales grew more than 3% (real) in December, making another ATH. Recent housing and manufacturing growth has been exceptional.

All of this has been not just a tailwind for equities but also for treasury yields. The 10 year rose to 2.6% this week, the highest rate in 10 months. 2.6% has been an important high for 3-1/2 years; the last time it went higher was prior to June 2014.

There is nothing incongruent with equities (top panel) rising with yields (bottom panel). That, in fact, is a typical pattern, as positive growth underlies both.
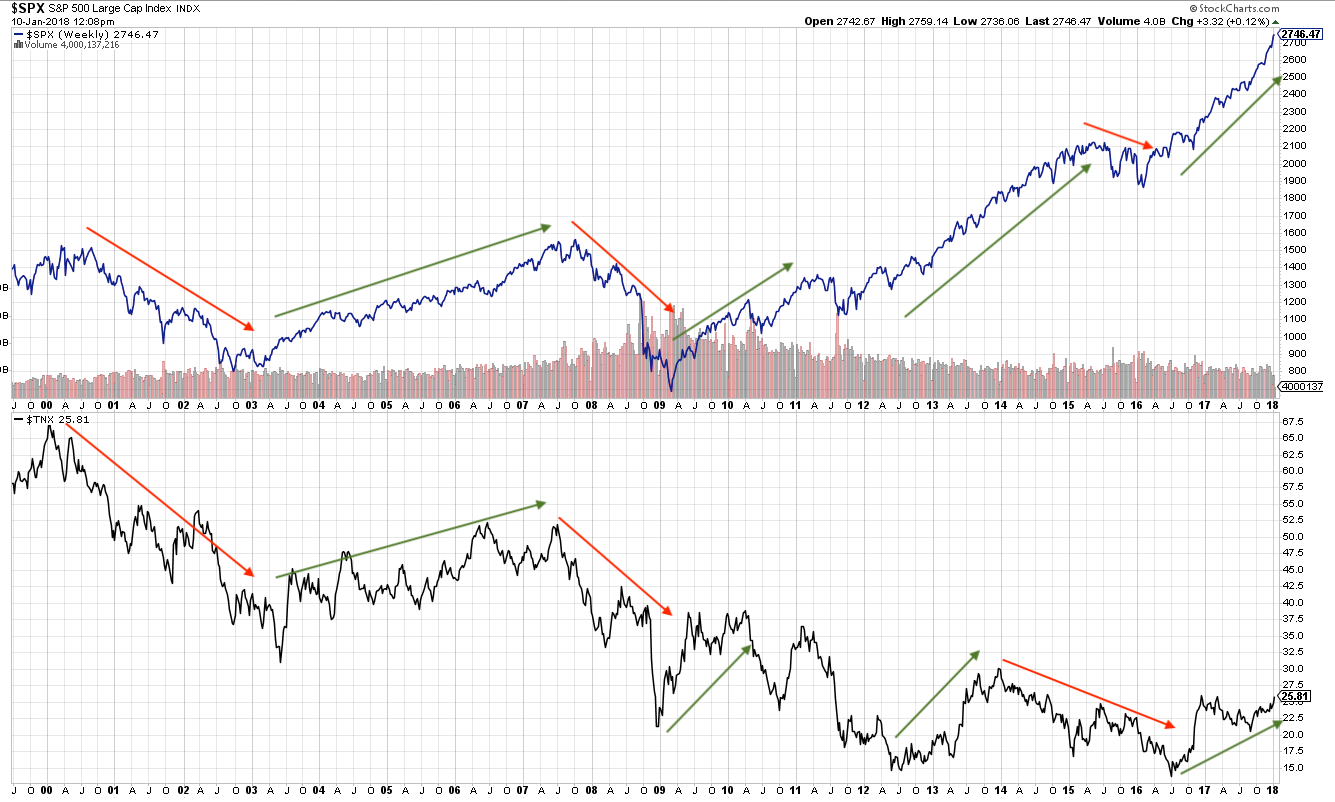
On a longer term basis, yields are butting up against the top rail of a down-sloping channel from 1981. That top rail is not sacrosanct; note that yields broke higher at the tail end of the last equity bull market, in 2007. It has otherwise been a highly relevant guidepost for yields.

The consensus is that yields are going much higher, but note that pundits have been calling for the end of the multi-decade bond super cycle for at least 6 years. Taleb's "every human should short treasuries" call came right before yields fell from 4% to 2.3% over the following half year (from Seeking Alpha).


Notably, commercial hedgers, who tend to be the "smart money", have substantially increased their long exposure to treasuries to one of the highest levels in 10 years. This has been close to prior reversal points in yields during this period (the chart below shows treasury prices, which move opposite to yields; from Sentimentrader; to become a subscriber, please use this link).

The rise in US equities has been remarkably consistent. SPX has not fallen more than 1.5% for the second longest stretch since the mid-1960s. The end of that streak was inconsequential; the index continued higher. Other streaks have been close to a notable top (red lines in 1989, 2007 and 2015). The end of this streak, followed by a rise in volatility and choppy trading would be a watch out that the current uptrend is in danger. Not yet (from Sentimentrader).

Volatility was among the lowest ever in 2017. In prior instances, low volatility years have been followed by a revision to normal volatility. A typical year has an intra year drawdown of 10%, the same as for years following periods of low volatility. Traders should expect this during 2018 (from Ryan Detrick)

Of course, betting against the trend has been a losing strategy since the November 2016 election. The current trend is extended but has, so far, shown no signs of letting up. SPX is up 15 months in a row on a total return basis. It has risen 17 of the last 21 weeks. It has risen 8 of the first 9 days of this year. It left unfilled gap ups 4 days in a row for the first time in its history last week (from Quantifiable Edges).

Right now, there is little reason to expect 2018 to finish lower. Trend, breadth, earnings, macro and volatility support higher prices. SPX has risen in 72% of the years since 1950 and in 79% of the years since 1980. High valuations matter to long run returns but have close to no correlation with next one-year returns.
The quick start to the year has had several notable affects on expectations.
The first is the belief that January predicts the returns for the rest of the year. As already stated, most years end higher. Seasonality is generally positive in January. Taken together, it is not a surprise that a good start to the year corresponds with a good year. Over time, January's direction is no more predictive to full-year returns than random (from Mark Hulbert).

The second affect is that investors' sentiment is reaching extremes. While excessive bearish sentiment coincides with equity lows, the same is not true for excessive bullish sentiment at tops. Many times, price continues higher.
For example, the number of bears polled by Investors Intelligence reached a substantial low this week but in all prior instances, SPX has been higher 3 months later and interim drawdowns have been minor (the next two charts from Nautilus Research).

Likewise, the number of bulls polled by AAII reached a substantial high this week. The results are the same: low interim drawdowns and price has been higher 6 months later every time.

The Investors Intelligence bull/bear ratio spiked to a 30 year high this week. The chart looks terrifying. Yet this is a sample of one and in that one example (from 1987), SPX rose 20% in the next 3 months and 35% in the next 7 months. Of course, it ended badly for those who entered late, but the year closed positive (from Yardeni).

Finally, the strong start to the year has pushed equity momentum to an extreme. The 14-period RSI for SPY ended Friday at 84, the highest in more than 20 years. The index has closed lower within the next 5 days every time except one, which closed lower 19 days later. Risk/reward over the next month was poor, i.e., gains were small and drawdowns large. However, 3 months later, the index closed higher in all instances but one (an 88% win-rate; from @Twillo1).


Instances where RSI(14) was near 80 are highlighted in the charts that follow. Only two instances from 1995-96 (circled) are near current extremes.


In summary, the dominant trend for equities remains higher, underpinned by strong economic data, earnings that are being revised higher and equity breadth that is expanding. By at least one measure, momentum is at a more than 20 year high: in prior instances, short-term risk/reward has been poor but longer term returns positive. Sentiment, which is exceedingly bullish, has also most often led to positive returns 3-6 months later. Net, the longer-term outlook for equities remains attractive.
The macro calendar is light this week. Monday is a holiday (MLK), industrial production is on Wednesday and housing starts/permits is on Thursday.
If you find this post to be valuable, consider visiting a few of our sponsors who have offers that might be relevant to you.