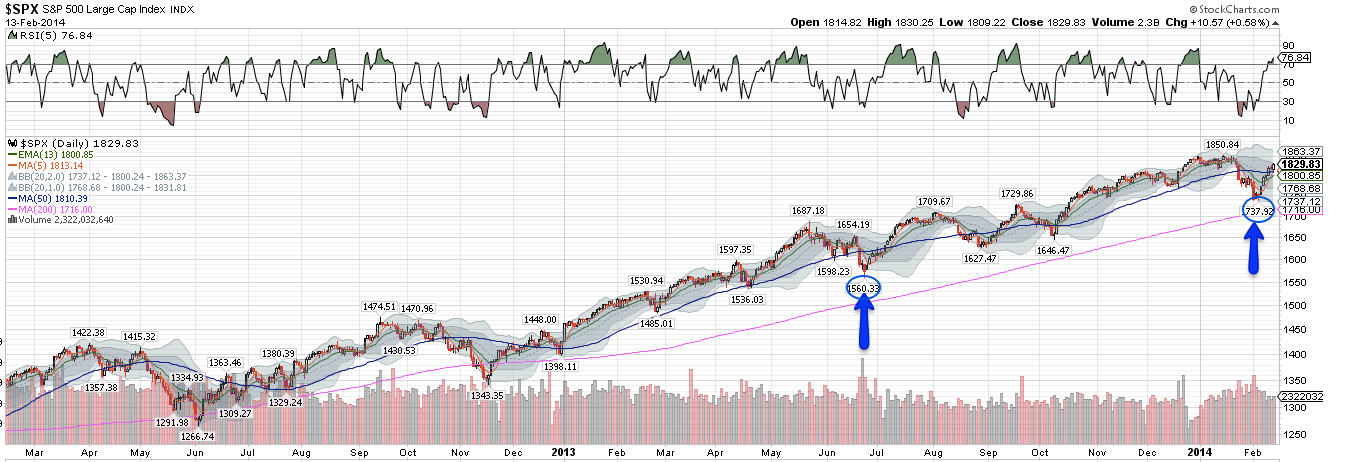
How does this pull-back compare to history?
If this is the largest drawdown suffered in 2014, it will be one of the smallest of the past 34 years. 85% of the time, the largest annual drawdowns are more than 6%. And even for a small pullback, half a month is short for the bottom to be found.
Let's review the data.
Since 1980, the median annual drawdown is 10.5%. Not surprisingly, then, about 50% of years have a drawdown of 5-10%. Every year, that's what investors should expect to endure during the next 12-months.
As you can see from the chart, there have only been five other years where the largest drawdown of the year was 6% or less. 85% of the time, it's been greater. In other words, what we had was a very minor pull back (chart from JP Morgan; see notes at bottom of page).
The recent correction took 18 calendar days. How long do drawdowns usually last?
A typical 5-10% fall takes one calendar month to reach a bottom ('duration') and then an additional two months to regain the prior high ('recovery'). Thus, a typical drawdown lasts a total of three months before the uptrend resumes (chart via @ObservationDesk).
Larger drawdowns obviously last longer. When the market falls 10-20%, it finds the bottom in five months and then takes another four months to regain the prior high, a total of 9 months. The 19% fall in 2011 was perfectly normal: peak in May, bottom in October and back to the May high in February 2012.
So, the recent correction was among the shortest and smallest. Is that it for 2014?
@PastStat looked at all 5% or greater corrections since 1950. The key take away was this: 74% of the time, a 5% correction (like the one we just had) will fall further by a median of 1.9%.
In other words, once the market has fallen by 5%, three-quarters of the time it will have at least one lower low about 2% lower. The full study is here.
This is not surprising: the market falls, bounces, and then retests the low forming either a double bottom or an inverted head and shoulders pattern. This is very common.
5% v-shaped bottoms are rare. According to the study, there have been only 8 since 1980, of which one was the last 5% correction that ended June 24, 2013.
But a retest of the low is even more common than the raw data suggest.
The following charts look at those seven other 5% pull-backs since 1980 that went no further. Either of two situations were present each time: the 5% fall was retested after a marginal higher-high, or the 5% fall was the retest of a prior fall in the market. In each chart, the 5% pull-back is circled.
1980: There were two 5% falls in 1980. The first was retested by the second four weeks later. There was a one month bounce to a higher-high in between. The second 5% fall was retested by a larger fall six weeks later in December, also after a higher-high, forming a short-term double bottom. All of these lows were taken out in 1981.
1991-92: The 5% fall in May 1991 was retested after a lower-high six weeks later. The 5% fall in October 1991 was retested after a higher-high six weeks later. And the 5% fall in October 1992 was itself the retest of a larger downtrend low from the start of the year.
1997: The 5% fall October 1997 was the 'head' of 5-month 'head and shoulders' bottom. And, finally, the April 1999 5% fall was retested two more times, six weeks later and then 10 weeks after that, with higher-highs in between.
2013-14: In comparison, the June 2013 low was an anomaly. It was not a retest of a prior low and it wasn't subsequently retested. The same is true for the low last week, so far.
So what does this all mean? In short, if that was 'the low', it was highly unusual.
- Pull backs normally last twice as long. Even in 2013, the pull-back lasted 5 weeks.
- And 5% falls are almost always retested at least once, the 2013 pull-back being a glaring exception.
If past is prologue, there should be a retest of the recent low. Based on the examples here, it would normally occur within 1-2 months. If the decennial and/or presidential cycle is in play, the ultimate low will be this summer.
In the meantime, SPY is back above its rising 13-ema and flattish 50-dma. Until that changes, the trend is higher.
__________________________________________________________________________
Notes on JP Morgan chart of intra-year declines
__________________________________________________________________________
Notes on JP Morgan chart of intra-year declines
- Strangely, only 12% of years have a drawdown of 11-15% but nearly 25% have a drawdown of 16-20%. In other words, either the drawdown is likely to be 10% or less or 16% or more. That's not a bell curve.
- It's not obvious from the data above that the market is becoming any more or less volatile over time. The distribution of drawdowns larger than 10% has been fairly uniform. There were five in the 1980s, four in the 1990s, six in the 2000s and two so far in the 2010s.


