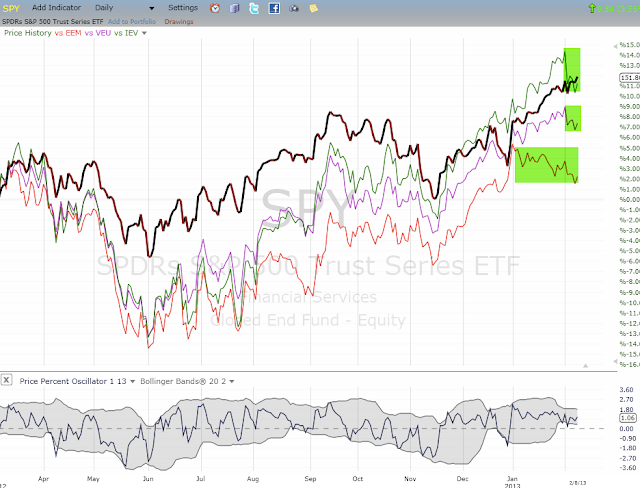
So, when divergences become apparent, it is at least a flag. In the second chart on daily timeframe, EEM has diverged since the start of January and Euro 350 since the start of February. Both are down 3-4% from their high while $SPX has moved up.
EEM and Euro 350 (IEV) are down 3-4% from their recent peaks while US indices are moving higher.

