Fundamentals have been driving the stock market higher, not valuations: earnings during the past 1 year and 2 years have risen faster than the S&P index itself (meaning, valuations contracted). The strong growth in company profits is not due to a net share reduction (e.g., buybacks) either.
Looking ahead, expectations for 10% earnings growth in 2019 looks far too optimistic and will likely be revised downward as the substantial jump in margins this year is unlikely to continue. Even maintaining these margins will be a stretch, and earnings are at risk of falling. Dollar appreciation and declining oil prices are additional headwinds.
Valuations are now slightly below their 25-year average. They are not cheap, but the excess from early 2018 has been worked off. If investors once again become ebullient, there is room for valuations to expand. With earnings growth at risk, the key for share price appreciation in 2019 is likely to hinge on valuations expanding.
* * *
90% of the companies in the S&P 500 have released their third quarter (3Q18) financial reports. The headline numbers are very good. Here are the details:
Sales
Quarterly sales reached a new all-time high, growing 11% over the past year. On a trailing 12-month basis (TTM), sales are 10% higher yoy, the best growth in 12 years (since 2006; all financial data in this post is from S&P). Enlarge any image by clicking on it.

The arrows in the chart above indicate the period from 2Q14 to 1Q16 when oil prices fell 70%. The negative affect on overall S&P sales (above) and the energy sector alone (below) is easy to spot.

The six sectors with the highest weighting in the S&P have grown an average of 12% in the past year (box in middle column) and, since the peak in oil in 2Q14, their sales have grown an average of 33%. In contrast, energy sector sales have declined 25% (far right column).

Excluding the volatile energy sector, sales for the remainder of the S&P have continued to trend higher at about the same rate over the past 7 years (blue line; from Yardeni).

The dollar has become a minor headwind for sales: in the past year (thru 3Q18), the dollar appreciated by 5%; this accounts for about a 2.5 percentage point decline in growth in corporate sales. For the current quarter (4Q18), the dollar is continuing to pace 5% yoy appreciation.
How does the dollar impact sales growth? Companies in the S&P derive about half of their sales from outside of the US. When the dollar rises in value, the value of sales earned abroad (in foreign currency) falls. If foreign sales grow 5% but the dollar gains 5% against other currencies, then sales growth will be zero in dollar terms. The chart below compares changes in the dollar (blue line; inverted) with growth in S&P sales (red line): a higher dollar corresponds with lower sales (from Yardeni).

Earnings and Margins
Quarterly EPS (operating-basis) is also at a new all-time high, growing 33% over the past year on a quarterly-basis and 27% on a trailing 12-month basis (TTM).

EPS on a GAAP basis is not much different: 30% growth yoy and 22% growth TTM. More on that below.
The arrows again indicate the period when oil prices fell 70%. The new high in total EPS comes with energy sector EPS at two-thirds of its level in mid-2014.

Likewise, overall S&P profit margins peaked at 10.1% in early 2014, fell to 8% at the end of 2015 and have since rebounded to new highs of 12.2% in 3Q18.

For most sectors, margins remained relatively stable while energy fell and rebounded in 2014-16. But since 1Q2014, non-energy margins have expanded from 9.7% to 12.7%.

Most of the largest sectors have done well, increasing their margins 1-2 percentage points in the past 1 year and 2 years.

But no large sector has done better than technology, where margins have shot up from 17% to 23% in the past 2 years. This partly explains why the technology sector has outperformed the S&P index.

There are some common misconceptions that are regularly cited with respect to corporate earnings.
First, companies have been accused of inflating their financial reports through a net reduction in shares through, for example, corporate buybacks. In reality, however, over 90% of the growth in earnings in the S&P over the past 8 years has come from better profits, not a net reduction in shares. Better profits have driven growth, not "financial engineering."

That has been true over the past 17 years, during which the net change in corporate shares has accounted for just 3% of EPS growth (from JPM).

In fact, the impact of share reduction has declined over the past two years as the difference between EPS and profits has markedly narrowed.

Second, equity prices are said to have far outpaced earnings during this bull market. In fact, better profits accounts for about 70% of the appreciation in the S&P over the past 8 years. Of course valuations have also risen - that is a feature of every bull market, as investors transition from pessimism to optimism - but this has been a much smaller contributor. In comparison, 75% of the gain in the S&P between 1982-2000 was derived from a valuation increase (that data from Barry Ritholtz).

Over the past 2 years (since 3Q16), during which time the S&P has risen about 34%, earnings have risen 47%, i.e., faster than the S&P index itself thereby accounting for more than 100% of price appreciation. The same is true over the past 1 year (from Bloomberg).

Third, financial reports based on "operating earnings" are said to be fake. This complaint has been a feature of every bull market since at least the 1990s. In truth, the trend in GAAP earnings (red line) is the same as "operating earnings" (blue line).

It's accurate to say that operating earnings somewhat overstate and smooth profits compared earnings based on GAAP, but that is not new. In fact, the difference between operating and GAAP earnings in the past 25 years has been a median of 10% and the recent history has been no different (it was 13% in the most recent quarter). Operating earnings overstated profits by much more in the 1990s and earlier in the current bull market. The biggest differences have always been during bear markets.

Growth Outlook for 2018 and 2019
Looking ahead, the consensus expects 21% earnings and 9% sales growth for this year, dropping to 9% earnings growth and 5% sales growth in 2019 (from FactSet). There are four considerations with a strong bearing on forward sales and earnings.
First, as a baseline, it is reasonable to assume that corporate (non-energy) sales growth will be largely similar to the nominal economic growth rate of 4-5%, excluding currency effects (from the OECD).

Second, the dollar weakened from the end of 2016 to mid-2018 (a tailwind to growth) but has since appreciated 5%. That means that currency effects are no longer a tailwind to growth. With half of corporate sales coming from abroad, a small 4% appreciation in the dollar could cut 2 percentage points to sales growth next year (second chart from JPM).


Third, the price of oil was tracking a healthy 28% yoy gain until October; the price has since fallen 25%, to where it had been a year ago. In other words, the energy sector had been a tailwind to overall sales and EPS growth; below $65, it becomes a headwind in the first half (1H) of 2019.

As we have seen, the direct impact of oil prices on the energy sector is far more important than any ancillary affects on other sectors. As an example, consider this: the price of oil fell from over $100 to under $50 between mid-2013 and mid-2016 but non-energy sector operating margins were 10% in both instances. In short, lower oil prices are a net negative for sales and earnings.
The tax cut is a one-off adjustment, applicable only to 2018, and there is not much reason to expect it to permanently raise growth rates. Why? US corporations are not capital constrained; they have abundant cash and access to low cost debt and equity. Moreover, corporations have been making fixed capital investments. Over the past 3 decades, rising corporate profitability (blue line) has had no positive affect on new investments (red line; from the FT).

Risk for 2019: Margins Contraction
Next year, the consensus expects 9% earnings and 5% sales growth. Sales growth expectations are fine (barring major dollar appreciation) but the expected earnings growth looks far too optimistic.
The primary reason for skepticism is margins. For earnings to grow faster than sales, margins have to expand. But after trending higher over the past 7 years, margins jumped 260bp in just the past three quarters. This is a massive rise and sustaining that level (let alone expanding margins further) is too aggressive an assumption, especially in light of rising labor and interest expenses.

All else equal, a generous guess would be that earnings in 2019 will grow no faster than sales (5%). If the dollar continues to appreciate, that growth could drop to just 3%. If margins fall (and that is a definite possibility), earnings will contract.
Valuation
With the relatively minor appreciation in equity prices so far in 2018, valuations are slightly below their 25-year average (from JPM).
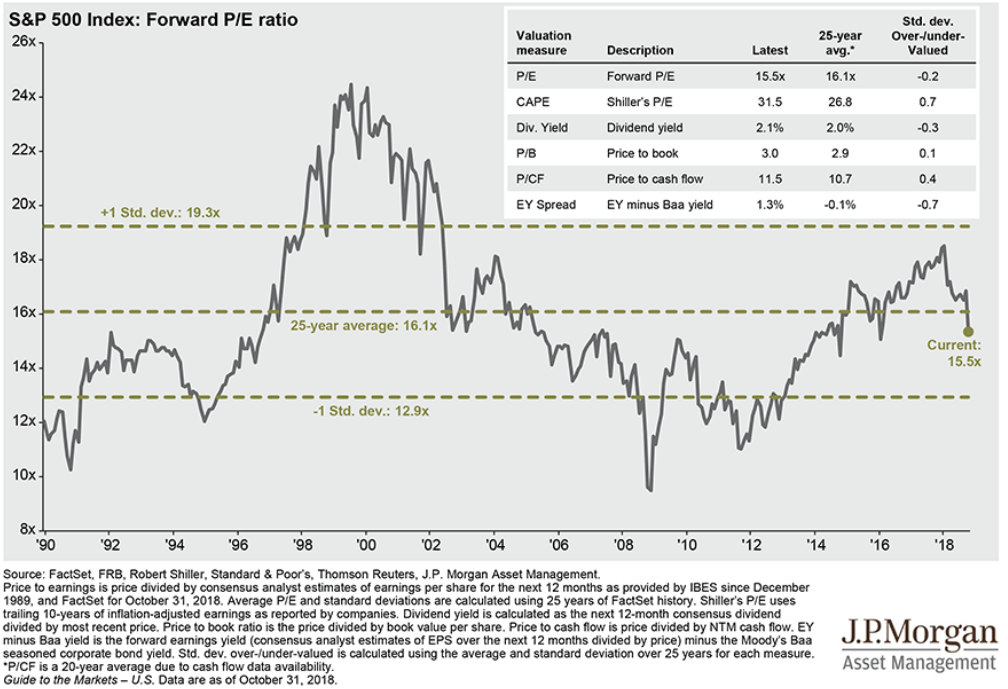
Valuations are not cheap, but if investors once again become ebullient, there is room for valuations to expand. Why? When investors become bullish (blue line), valuations rise (red line). Investors had been pessimistic in early 2016 and then became far too optimistic at the market peak in January 2018. That has been greatly reset in recent months (from Yardeni).

Valuations are influenced by more than investor psychology. Part of the reason equities have become more expensive over time is rising corporate profitability. Margins have reached successive new highs with each economic cycle over the past 3 decades: they are now more 100bp higher than in 2007, and that peak was more than 100bp higher than in 2000. Higher profitability (and growth) is typically rewarded with higher valuation multiples (from JPM).

While it is objectively impossible to know when or at what level margins will peak for this cycle, it's a reasonable guess that significant further upside is probably limited.
Importantly, valuations have almost no bearing on the market's 1-year forward return (left side). But over the longer term, current valuations suggest that single digit annual returns are odds-on (right side; from JP Morgan).

In summary, corporate results in the third quarter were excellent. Fundamentals (not valuations or share buybacks) have been driving the stock market higher.
Looking ahead, expectations for 10% earnings growth in 2019 looks far too optimistic and will likely be revised downward as the substantial jump in margins this year is unlikely to continue. Earnings are at risk of falling. Dollar appreciation and declining oil prices are additional headwinds.
Valuations are now slightly below their 25-year average. If investors once again become ebullient, there is room for valuations to expand. With earnings growth at risk, the key for share price appreciation in 2019 is likely to hinge on valuations expanding.
If you find this post to be valuable, consider visiting a few of our sponsors who have offers that might be relevant to you.