7 months later, global equity allocations have fallen to the lowest level since the November 2016 election, and cash balances are relatively high. Investors are no longer bullish, although the global equity correction has not made them outright bearish by most measures.
The US has been the best performing region of the world in the past year, yet fund managers have been consistently underweight. That has now changed; in July, US allocations rose to a 17-month high. It's not yet extreme, but a big tailwind behind US outperformance is now gone.
Emerging markets have massively underperformed since April when allocations to the region rose to a 7-year high. In July, allocations fell to the lowest since January 2017. This region is now a modest contrarian long again.
Fund managers' are close to neutral on bonds, but their inflation expectations remain near a 14-year high and their commodity allocations are near an 8-year high. This has previously led US 10-year yields to stagnate or fall.
* * *
Among the various ways of measuring investor sentiment, the Bank of America Merrill Lynch (BAML) survey of global fund managers is one of the best as the results reflect how managers are allocated in various asset classes. These managers oversee a combined $600b in assets.
Our sincere gratitude to BAML for the use of this data.
The data should be viewed mostly from a contrarian perspective; that is, when equities fall in price, allocations to cash go higher and allocations to equities go lower as investors become bearish, setting up a buy signal. When prices rise, the opposite occurs, setting up a sell signal. We did a recap of this pattern in December 2014 (post).
Let's review the highlights from the past month.
Overall: Relative to history, fund managers are overweight cash and commodities, underweight equities. Enlarge any image by clicking on it.
Within equities, the US is now overweight while emerging markets in particular are now underweight. This is a significant change from the past year.
A pure contrarian would overweight emerging markets equities relative to the US and underweight cash.

Cash: Investors' cash balance is high at 4.7% (BAML considers cash levels above 4.5% to be a contrarian long for equities). This is still supportive of further gains in equities. A recap:
Fund managers' cash levels rose to 5.8% in October 2016, the highest cash level since November 2001. This set up a contrarian long in equities.
Cash remained near 5% until November 2017, when it fell to 4.4%, the lowest level since October 2013.
With the equity sell off early this year, cash rose to 5% in April and remains high in July; this is still a tailwind for equities.

Likewise, fund managers are a net + 29% overweight cash (+0.7 standard deviations above its long term mean). In the context of a bull market, cash should underperform a 60-30-10 basket.

Global equities: After reaching a bullish extreme in January 2018, global equity allocations have fallen below neutral. A recap:
Fund managers were just +5% overweight equities at their low in February 2016; since 2009, allocations had only been lower in mid-2011 and mid-2012, periods which were notable bottoms for equity prices during this bull market.
By January 2018, equity allocations had increased to +55% overweight, the highest level in nearly 3 years. Outside of 2013-14, over +50% overweight has historically been bearish (dashed line and shading). Our view was that "this is a headwind to further gains."
After the recent correction, equity allocations fell to 19% overweight in July
(-0.4 standard deviations below its long term mean), the lowest since November 2016. This is below neutral. Sentiment is no longer at a bullish extreme, but investors haven't become outright fearful during the recent shakeout.

On a net basis, fund managers expect profits to deteriorate in the next 12 months, their most bearish view since February 2016. Negative profit expectations also marked equity bottoms in mid-2010, late-2011 and mid-2012.

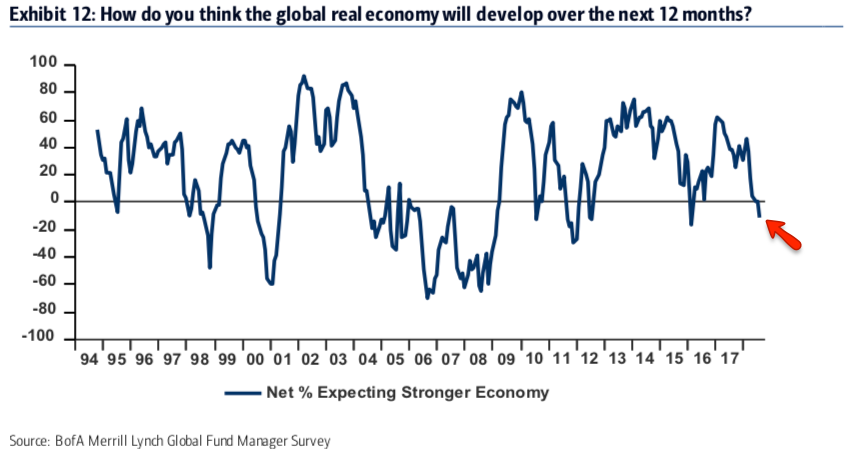
Similarly, macro expectations have fallen hard in recent months: a net -11% expect a better economy in the next year - the lowest since equities bottomed in February 2016 - down from a net +47% in January 2018. This is also where equities bottomed in mid-2010, late-2011 and mid-2012. Investors are now bearish on the global economy.

US equities: After being out of favor for 17 months, fund managers are overweight US equities. It's not yet extreme, but a big tailwind behind US outperformance is now gone. A recap:

Similarly, macro expectations have fallen hard in recent months: a net -11% expect a better economy in the next year - the lowest since equities bottomed in February 2016 - down from a net +47% in January 2018. This is also where equities bottomed in mid-2010, late-2011 and mid-2012. Investors are now bearish on the global economy.
US equities: After being out of favor for 17 months, fund managers are overweight US equities. It's not yet extreme, but a big tailwind behind US outperformance is now gone. A recap:
Fund managers were underweight US equities for a year and a half starting in early 2015, during which US equities outperformed.
From December 2016, to February 2017, investors overweighted US stocks. US equities underperformed their global peers.
In September 2017, investors again became bearish US equities, giving them the lowest allocation in 10 years. US equities have since outperformed.
After being out of favor for 17 months, fund managers are finally overweight US equities: allocations in July were -+9% overweight. It's not yet extreme - above +20% overweight and sentiment typically becomes a strong headwind (yellow shading) - but a big tailwind behind US outperformance is now gone.
Note that the relationship between performance and weighting worked less well in the prior expansion cycle (2003-07) as emerging markets outperformed developed markets by about 5 times.

Fund managers had been excessively overweight European equities in 2015-16, during which time European equities underperformed.
That changed in July 2016, with the region becoming underweighted for the first time in 3 years. The region then began to outperform.
Allocations to Europe have been excessively overweight the past year, during which time the region has underperformed.
Allocations fell to +12% overweight in July. This is now neutral (-0.2 standard deviations below its long term mean) although Europe is still the most favored region in the world.

In January 2016, allocations to emerging markets fell to their second lowest in the survey's history (-33% underweight).
As the region outperformed in 2016, allocations rose to +31% overweight in October 2016, the highest in 3-1/2 years. That made the region a contrarian short: emerging equities then dropped 10% in the next two months.
Allocations fell to -6% underweight in January 2017, making the region a contrarian long again: the region then outperformed.
In April, allocations rose to +43% overweight, near a 7 year high. Sine then, the region has underperformed the US by 1400bp.
In July, allocations fell to -1% underweight, the lowest since January 2017 (-0.9 standard deviations below its long term mean). This is now a modest contrarian long again.

Global bonds: Bond sentiment has improved in recent months; they are no longer a strong contrarian long. A recap:
In July 2016, global bond allocations rose to -35% underweight, nearly a 3-1/2 year high. Bonds subsequently underperformed a 60-30-10 basket.
In January 2018, allocations to bonds dropped to -67% underweight (-1.2 standard deviations below its long term mean), a 4 year low. This was a capitulation low, and US 10 year treasuries have since outperformed US equities (NYSE) by about 500bp.
In July, allocations rose to -48% underweight (-0.3 standard deviations below its long term mean). This is close to neutral and thus there is no longer a strong contrarian tailwind behind bonds.

That said, 79% of fund managers expect higher inflation over the next 12 months; this is near a 14 year high. Higher inflation is a strongly consensus view (first chart). In the past, the consensus view has corresponded to a drop in US 10-year yields in the months ahead (second chart).


Higher inflation expectations goes in hand with higher commodity allocations: in July, fund managers' were a net +6% overweight (+0.6 standard deviations above its long term mean), nearly the highest in 8 years.

- Cash: The typical range is 3.5-5.0%. BAML has a 4.5% contrarian buy level but we consider over 5% to be a better signal. More on this indicator here.
- Equities: Over +50% overweight is bearish. A washout low (bullish) is under +15% overweight. More on this indicator here.
- Bonds: Global bonds started to underperform in mid-2010, 2011 and 2012 when they reached -20% underweight. -60% underweight is often a bearish extreme.
- Commodities: Higher commodity exposure goes in hand with improved sentiment towards global macro and/or inflation.
If you find this post to be valuable, consider visiting a few of our sponsors who have offers that might be relevant to you.