* * *
Trend
- NDX and COMPQ made new all-time highs (ATH) again this week. SPX made a new ATH on a closing basis, eclipsing the prior high from March 1. The primary trend is higher.
- SPX ended the week overbought (as measured by the daily RSI(5)). Upwardly trending markets are partially defined by their ability to become and stay overbought. This is a positive sign so long as it persists.
- After becoming overbought, the rising 13-ema is normally the approximate first level of support on weakness. This moving average has not been touched in the past two weeks, a positive sign of trend persistence. That level is approximately 2380 (a chart on this is here).
- SPX has now risen 3 weeks in a row. This is a positive sign of momentum. SPX has a strong tendency to make a higher high after rising 3 weeks in a row (blue lines in the chart below).
- All of the above said, markets undulate higher. Even the most persistent trends suffer setbacks, however temporary. The current uptrend is now one of the three longest since the low in 2009; if past is prologue, a 5% correction is odds-on by the end of June. That should be the expectation of swing traders heading into summer. Read last week's post on this here. Enlarge any chart by clicking on it.

- The cumulative advance-decline for both the NYSE and SPX are at or near new ATHs. According to Sentimentrader, when this occurs while indices are at a new high (like now), SPX has been higher 1-2 months later 18 of the last 19 times. That doesn't preclude an interim swoon, but it does mean a meaningful top now is highly unlikely.
- The very broad NYSE index is within 0.5% of its ATH, a further sign that breadth is largely fine.
- True, there are some "breadth divergences" in indices versus their equal-weight benchmarks, but these have been too inconsistent markers of upcoming risk to be useful (a chart on this is here).
- On balance, overall breadth measures are supportive of the trend higher.
Sentiment
- After a three week rally, sentiment is again becoming bullish, especially when measured by Investors Intelligence and NAAIM.
- In contrast, the 4-week AAII bull-bear spread is still emerging from a relatively high level of pessimism, suggesting more upside. That is also true to the BAML survey of fund managers. A post on this is here. And equity funds saw net outflows over the past month, hardly a sign of excessive bullishness (chart below).
- On balance, some of the tailwind in sentiment has been expended but it is not yet a clear headwind. On further gains this week, we'll be watching put/call ratios closely.

Macro
- Employment gains bounced back last month after a very weak print in March. A new post on this is here.
- Too much is probably being made of flattening auto sales. The current level is tracking a SAAR of 16.7m units in 2017. Even if this drops further to 16.5m, the reduction in GDP growth would be a mere 10 bp, according to BAML.
- Macro expectations in 1Q17 were well ahead of the actual data, a circumstance under which equities normally suffer a setback, hence the recent (mild) 3% fall in SPX (a chart on this is here).
- Those macro expectations have now fallen to a 7-month low. During the current bull market, macro data has normally outperformed expectations in the second half of the year. This is likely setting up to be a tailwind, especially on further short term weakness (a chart on this is here).
Volatility
- There are no significant abnormalities at present in the term structure of volatility.
- Overall, low volatility is consistent with a grind higher in equity prices.
- For the first time in a decade, VIX dropped close to a 9-handle this week (closing basis). Is VIX likely to mean revert higher? Absolutely; the all-time low VIX is only slightly lower, at 9.2. The risk is clearly to the upside.
- But timing when this will happen is tricky. For example:
- When VIX dropped to a 9-handle for the first in the 1990s bull market (1993), SPX gained another 3% in the next two months.
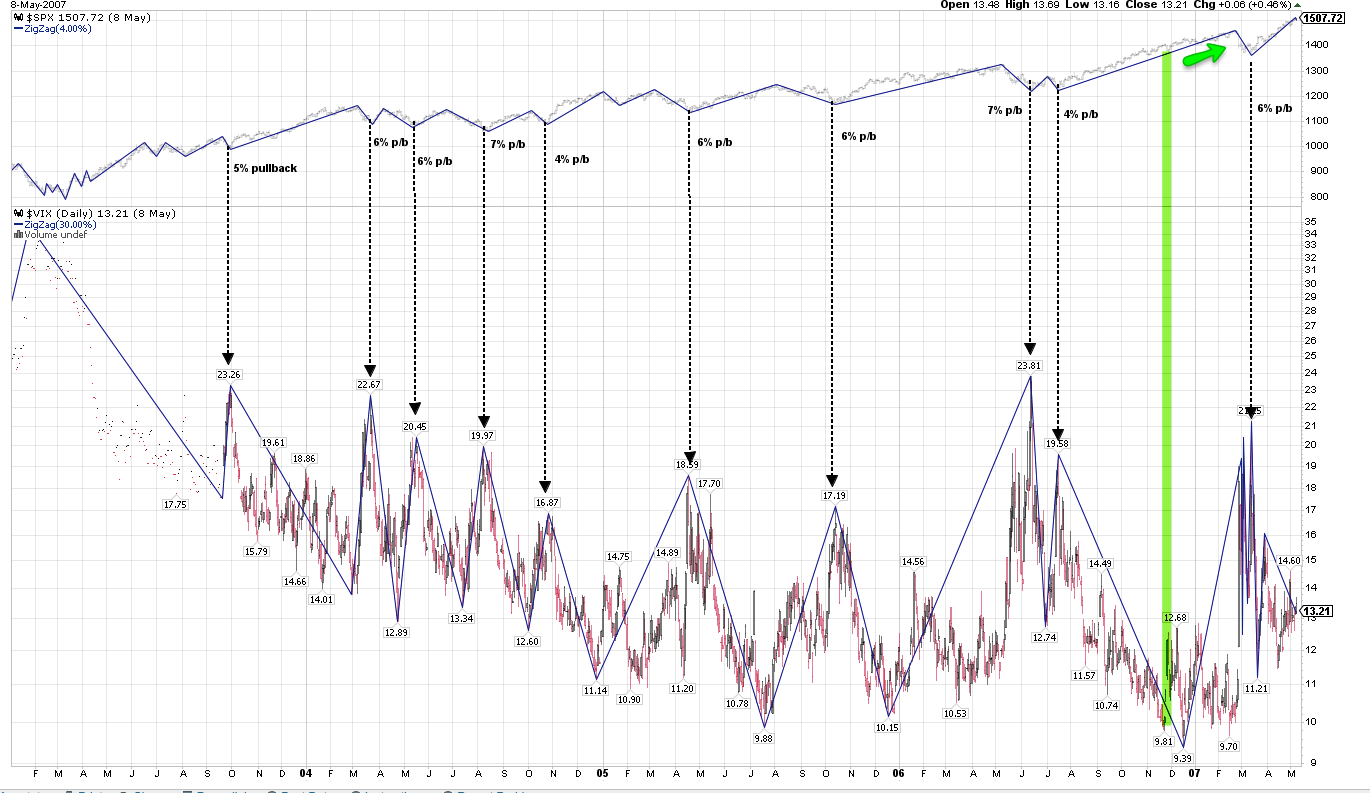
- When VIX dropped to a 9-handle for the first in the 2000s bull market (2006), SPX gained another 5% in the next three months (green shading in the chart below).
Seasonality
- A pop higher in VIX and the first 5% correction of the year become more likely as the summer season begins. Seasonality can be finicky, but there's a broad tendency for a swoon by late June that then sets up a summertime rally in July and a second low in late summer (first chart below, from LPL).
- Years that start strong, like 2017 and 2013, also have a tendency to do better during the summer. If that is true again this year, the persistent grind higher in equities may continue (second chart below, from Dana Lyons).
- Our view on May-October seasonality is here.


- A little over 60% of the companies in the S&P 500 have released their 1Q17 financial reports. The headline numbers are good.
- Overall sales are 7.2% higher than a year ago, the best annual rate of growth in more than 6 years.
- Earnings (GAAP-basis) are 22% higher than a year ago.
- Profit margins are back to their highs of nearly 10% first reached in 2014. A new post on this is here.

Events
- Most of the gains in the past two weeks have come on only three days: the two days after the first French election and on Friday, the day before this weekend's runoff election. It's not a stretch to say that this event, more than any other, has been the market's main focus over the past several weeks.
- There are no other significant events on the calendar for this week, until Friday (retail sales).
- If Macron wins in France, as expected, there's certainly a "sell the news" event risk to watch out for.
If you find this post to be valuable, consider visiting a few of our sponsors who have offers that might be relevant to you.