* * *
Today, SPX, DJIA, COMPQ and NDX have all made new all-time highs (ATH). All of the moving averages, from 5-d to 200-d, are rising for each of the respective indices. This is the definition of an uptrending equity market. Enlarge any chart by clicking on it.

The trend higher is supported by mostly good breadth. All of the cyclical (pro-growth) sectors are near one-year highs (green shading). The laggards are the defensive sectors.

Similarly, the Summation Index (NYSI) has regained the +500 level after having been negative two months ago. When equities are up trending (i.e., above their rising 200-d), this set up has led to longer term gains in equities (blue vertical lines). That doesn't preclude a near term drop, however, as seen in November 2014.

The trend higher in US equities is also supported by mostly positive macro data (a new post on this is here). Total employment, real disposable income per capita, real personal consumption and real retail sales are all at new highs. In the past year, hourly wages have increased at the fastest pace in nearly 8 years (second chart). Consumer loan delinquency rates are at a 30-year low (third chart). In short, the equity market is entering 2017 on a relatively solid economic foundation.


Notably, most Wall Street strategists are cautious about the upside potential for equities in 2017. The range of forecasts is for a 3-5% gain. The SPX has nearly reached the year end target for almost half of these strategists (from Barron's).

(Side note: 8 of 10 strategists favor financials in 2017, while all except one think staples should be avoided. These look like very crowded trades).
Historically, gains of less than 5% - in other words, a modest year - are the exception. Since 1980, the SPX has posted an annual gain 76% of the time, and when it gains, it does so by more than 5% 82% of the time. Similarly, when the market falls, it does so by more than 5% 75% of the time. In short, if equities are set up for a positive year - and that's the way it looks right now - then most of these strategists are likely too conservative (from JPM).

Stating the obvious, positive years don't occur without some drama along the way. In the chart above, every year except one has had an intra-year drawdown of more than 5%, and the average is nearly 15%. Expect 2017 to be no different.
While Wall Street is cautious on the year, it is difficult to argue that investors have not become overly bullish in the short term. This suggests that the drama for equity markets is likely to come sooner than many currently expect.
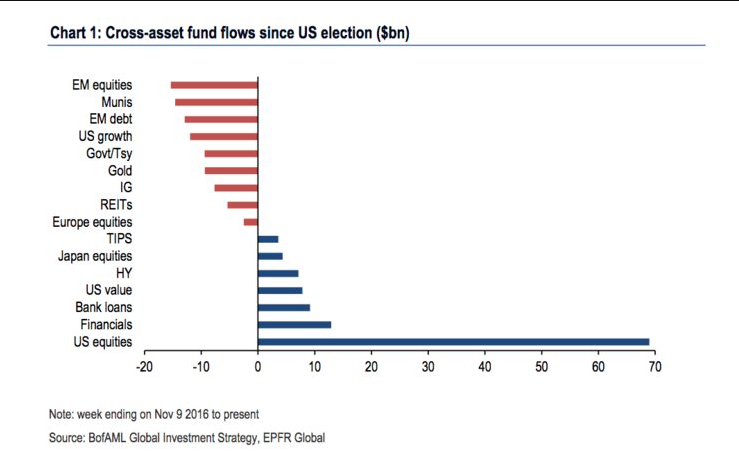
After 1-1/2 years of equity fund outflows, inflows have totaled about $50b in the past two months (first chart, from ICI). Fund flow data from BAML is even more lopsided in favor of US equities (second chart).

Similarly, bulls outnumber bears among investment advisors polled by Investors Intelligence by more than a 3:1 margin (the spread is 42%). It can become more extreme (top panel) but this has been where SPX trading has become choppier and gains have been given back (lower panel; from Not Jim Cramer).

As equities have gained, volatility has dropped to an extreme. In the past 20 years, the volatility index has rarely been lower. It can go lower, but normally current levels are near a point of reversion (lower panel). The biggest exception was the 5 month period from October 2006 to February 2007, during which SPX gained another 7% before all of these gains were given back. A reversion in volatility soon, or subsequent gains in SPX given back later, is the likely set up now as well.


The trading range in SPX has contracted to a relative extreme in the past month (lower panel). When this has happened in the past, volatility has typically increased by 50-100% within a month (red boxes, middle panel). As volatility usually moves opposite to equity prices, SPX has usually chopped and then fallen (top panel).

1-month protection is now trading at less than 80% of 3-month protection. Normally, SPX has tended to chop sideways for the next 1-2 weeks with any gains given back (shading). The sole exception in the past 3 years was in early December (red arrow).

Net, there's a set-up for volatility to spike higher. With equities trading at ATHs today, there is no price reversal to trade against. A price reversal could be marked by a high wick candle or by price closing under it's 5-d and the slope of the 5-d flattening and then inverting. Importantly, neither of these has happened yet.
SPX is less than 1% from 2300. These "round numbers" have reliably been resistance zones during SPX's advance, with the index reacting by at least 2-3% and often more. A fall to the Bollinger mid-band implies a 4% drawdown. On this basis, the short-term risk-reward for longs is now unfavorable.

Lastly, before the holidays we wrote about the potential for treasury yields to reverse (that post is here). TLT has since gained about 3% and is testing it's falling 50-d for the first time since September. That should be a point of reaction (shading). A second close above, with the 50-d flattening, would a positive sign for further gains in TLT.

In summary, US equities are starting the year at new all-time highs. The rally is supported by healthy breadth and a relatively solid economic foundation. The biggest watchout is volatility, which has fallen to an extreme. A mean reversion in volatility is odds-on and that is normally unfavorable, short term, for equities.