Overall, however, risk is rising, as the market now has a potentially bearish technical pattern that it didn't have in August.
* * *
A bad week for the US markets: SPY and DJIA fell by 3.6%. NDX led equities to the downside, losing 4.4%. Oil was the biggest loser, dropping 8%.
Treasuries gained, but not by much. TLT was up 0.5%.
(After the cash markets closed on Friday, a terrorist attack in Paris left 130 dead and more than 100 seriously wounded. The index futures fell 1%. Eddy Elfbein has looked at the affect these disasters have on the stock market; in short, there is no lasting impact. Read his post here).
There appear to be several good reasons to expect prices to move higher, perhaps not on Monday, but during the course of the next several days.
More generally, however, risk is rising. The probability of the indices falling directly into a bear market in August was low. Bull markets weaken before rolling over: the first fall of 10% after a long run higher doesn't lead to a bear market (arrows); bear markets start from the retest of the prior high that fails (vertical lines). That retest happened last week. That the indices fell hard this week was not a good sign.

We don't know if this will lead to further weakness and confirm a failed retest of the high. The point is the market has a potentially bearish technical pattern that it didn't have in August. We used that fact to aggressively buy the August and September plummets. Risk is now higher and greater caution is warranted.
The set up for this week was for the indices to retrace some of their recent gains. Recall, SPY had risen 6 weeks in a row from the September low, and had gained 12% with virtually no giveback along the way. It was a stair step higher that had already started to fade last week.
There were two main reasons to expect a retrace of some of the October gains (read last week's post on this topic here).
First, the pattern after similar thrusts off a low in the past 6 years had been to give back some of the gains before going higher. In the chart below, the boxes are all equal in size to the October rally. All except 1 (green shading) retraced some of those gains (arrows). This week fits that pattern.

The retrace this week was 38% of the September-November move. The drop felt significant, and it was a lot for one week, but 38% would be considered a normal retrace. It could give back 50% or more and still be part of a typical uptrend.

The second reason to expect a trace this week was seasonal: the week(s) after a strong NFP report are typically weak, and the middle part of November (orange arrow), especially after a strong October (first green arrow), is also prone to a retracement. This seasonal pattern is still in effect (data from Stock Almanac).

From a purely technical perspective, NDX seems to be driving SPY lower. The chart below is also from last week; NDX had left an enormous open gap on October 23 after having already risen 10% (green shading, far right). Of note, it also did this last year, and that gap eventually filled (green shading, left side). Last time, the filled gap became strong support. This week, NDX filled the gap. A good guess is this now becomes initial support.

In the chart above note that RSI is at an 'oversold' level consistent with other periods near a low (yellow arrows). Also note that the 50 and 200-dma are near a positive cross. Those moving averages could be support on further weakness next week. So far, there is no foul in the NDX chart.
NDX dropped 5 days in a row this week. In the past 5 years, NDX has dropped 5 days in row 12 times: in 11 of 12, NDX was higher within the next 5 days; in 10 of 12, NDX was also higher at the end of 5 days. The risk/reward was attractive for longs 90% of the time and it is now as well. Only 2012 continued to fall (data from the excellent Index Indicators site).

SPY has now moved from the top of its old trading range to the bottom. Moreover, there were 9 trading days, between October 9-22, where either the day's high or low was the 202 area (yellow shading). That area should provide initial support now again. More than 1-2 days below the bottom of the range would be cause for concern. So far, there is no foul in the SPY chart either.
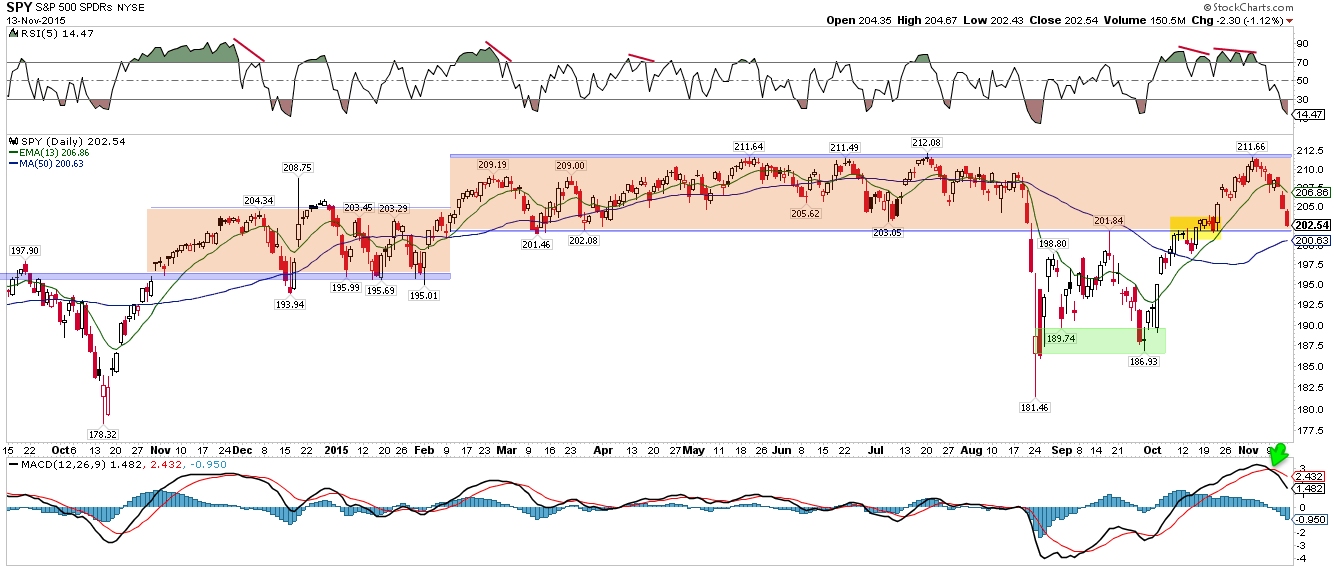
The low on Friday was just above an open gap from October 22 that fills at 201.9 (arrow), adding further weight to the 202 area. 60' RSI is both 'oversold' and showing a potential positive divergence, meaning some of the downward momentum is starting to dissipate; late August and both early and late September were similar and in all three instances, it took at least an extra day for the low to form. That means Monday could be a base building day. A conservative approach would be to wait for downward momentum to dissipate further in the next day or so.

The selling on Friday ended with a spike higher in the equity-only put/call ratio. We don't follow single day readings very often, but this one was extreme and noteworthy. A spike like this has happened only 7 other times in the past 5 years. The sample size is small but SPY has closed higher within 4 days each time following similar spikes. One instance saw a significant drawdown (August this year) but in general the risk/reward has been very attractive (data from Index Indicators).

The selling this week was swift enough to push short term breadth to an extreme: only 5% of stocks in the SPX are now above their 10-dma. In the past 5 years, there have 28 instances where less than 10% of SPX stocks have been above their 10-dma: in 26 of 28, SPX was higher within the next 5 days; in 22 of 28, SPX was also higher at the end of 5 days. There were two big failures, but overall the risk/reward was attractive (data from Index Indicators).

It's quite possible that any short term bounce fails and a lower low forms over the next few weeks. Volatility spiked this week, pushing VIX outside its upper Bollinger Band. In general, these spikes tend to come in pairs (vertical lines). In those cases that they don't, it is usually because the first spike was extreme and prolonged (like August this year; shading lower panel). A bounce and then a lower low in SPX would fit the seasonal pattern of weakness in November after a strong October.

Sentiment among "outsiders" weakened this week. There was an outflow of $3.5b from US equity mutual funds and ETFs. We discussed this last week: there has been a net outflow of money since the August low. This is usually a bullish sign, so long as equities are rising.
"Insiders" are now becoming more bullish. It's still early, but this is usually a good sign: insiders aren't always right - no one is - but their timing has tended to be very good. Further weakness next week would likely push insiders into a more clearly bullish position (data from Barron's).

Next week is November Opex. Historically, it's a mildly bullish week (up 14 of 21). The Monday of Opex tends to be weak (down 12 of 21). That tendency would fit with a base forming day to start the week (data from Stock Almanac).

Overall, there appear to be several good reasons to expect prices to move higher from this week's close, perhaps not on Monday, but during the course of the next several days. Again, keep in mind that overall risk has risen.
Two other charts of note. First, 5-year treasury yields rose to the top of a two year range from which they have been close to reversing. Strength in treasury yields might be near an inflection point.

Second, gold, which is mired in a multi-year downtrend, might be setting up for a short-term bounce higher. Note the similarities in base (middle panel), lessening of momentum (upper panel) after trading under its lower Bollinger (lowest panel). It's not yet ready, but perhaps soon.

On the economic calendar, industrial production and CPI data are released on Tuesday, and housing starts data is on Wednesday.
We published two other reports this week we hope you'll read:
On Tuesday, we reviewed the poor 3Q financial results and the implications for equity performance in 2016. Read it here.
On Thursday we reviewed corporate buyback activity, separating the truths from some of the widely quoted myths. Read it here.
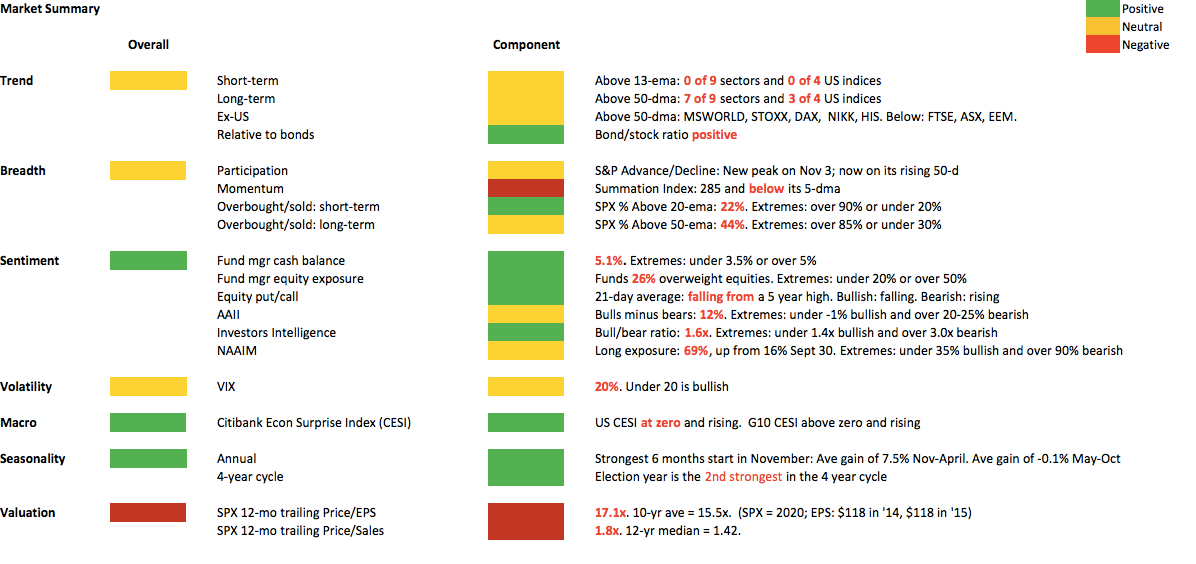
Our weekly summary table follows:
If you find this post to be valuable, consider visiting a few of our sponsors who have offers that might be relevant to you.