It is true that buybacks are an important source of demand and that it has pushed the market indices higher. So it's noteworthy that the amount of money being spent on buybacks has been declining since the start of 2014. That US equities have struggled to move higher over the past 5 months might well reflect, in part, the diminishing inflows from stock buybacks.
* * *
One of the things that everyone knows is that the stock market has been driven by stock buybacks. So it's noteworthy that the companies doing buybacks have not been outperforming the S&P in the past 18 months.
For most of 2014, the S&P index (blue line) outperformed the buyback index (red line). So far in 2015, their performance has been exactly equal. Both have vastly underperformed the Nasdaq 100 (green line).

(The Powershares Buyback ETF used in the chart above follows the "Nasdaq BuyBack Achievers Index", which is comprised of stocks that have effected a net reduction in shares outstanding of 5% or more in the trailing 12 months).
The belief that buybacks have been powering the stock market comes from two sources. The first is a bit of history: in 2013, the year the S&P rose 30%, the buyback index rose even faster, gaining more than 45%. Buybacks also beat the Nasdaq 100 in 2013.

As so often happens in the stock market, the legend of buybacks outperforming the market has outlived the reality, at least for now.
But the second aspect of how buybacks have powered the stock market is more enduring. Gross buybacks in 2014 totaled about $560b. That is nearly as much as companies spent on capital expenditures. And buybacks have been growing rapidly each year, increasing by 18% in 2014 and 20% in 2013.
These huge sums represent stock buying demand in excess of that from institutions and individuals. There is little doubt the stock indices have moved higher as a result of the money being spent on buybacks. This was also a pattern in the previous bull market (chart from Yardeni).

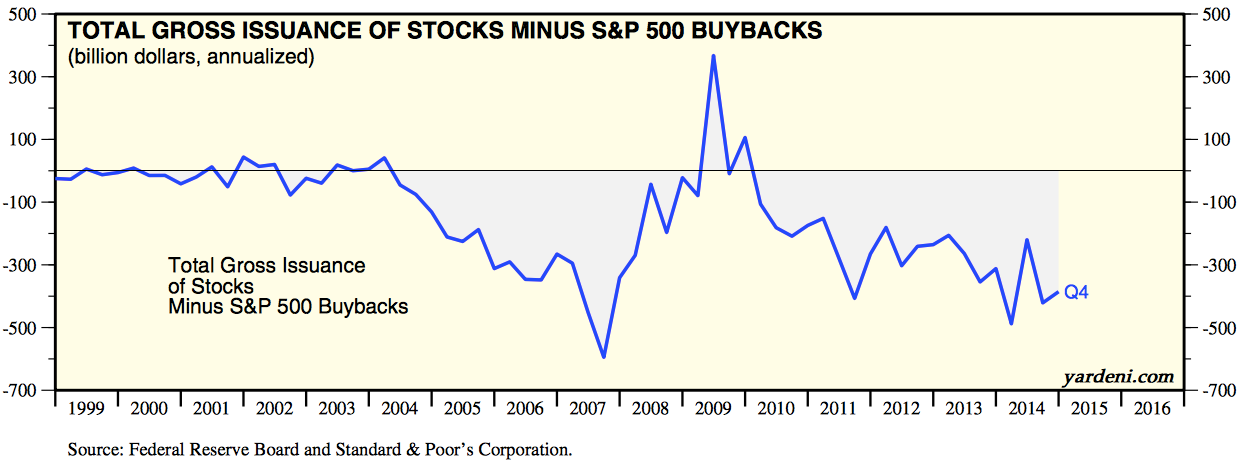
With buybacks contributing to overall equity appreciation, it's noteworthy that the amount of money being spent on buybacks has been declining since the start of 2014 (bars). 4Q14 had the first year over year decline in buybacks since mid-2012. Moreover, the number of companies in the S&P that are doing buybacks has also been declining, to levels from early 2011 and mid-2012 (green line). This chart and several that follow are from FactSet; their full report is here.

That US equities have struggled to move higher over the past 5 months might well reflect the diminishing inflows from stock buybacks. That said, Goldman expects the pace of buybacks to pick back up; their forecast is for an increase of 18% to $700b in 2015.
Another myth about buybacks is that they are responsible for most of the growth in corporate earnings per share (EPS). This is false. While the sums spent on buybacks in the past three years is about $1.5 trillion, the effect on shares outstanding has been minor: a reduction of about 2%. In comparison, EPS is up more than 20% during that time.

Part of the reason for this is that companies are continually issuing shares. Most prominently, executives are often given compensation in the form of share options; buybacks have become a way for the company to mop up the resultant increase in shares. Share buybacks might have amounted to $560b in 2014 but, net of issuance, it was closer to $400b (chart from Yardeni).
So buyback stocks are no longer outperforming the S&P, the amount of money being spent on buybacks has been declining over the past year and the impact of buybacks on EPS has been minor. One question remains: why don't companies that do buybacks outperform more consistently?
The size of the buyback program is not a determinant of outperformance. The S&P rose 13% in 2014, yet only 3 of the stocks with the top 10 largest buyback programs clearly beat the index (green); six stocks underperformed with two actually declining.

As detailed by Patrick O'Shaughnessy, the companies with inexpensive shares and strong earnings quality performed better than companies that simply had large share buyback programs (his post here). Let's look at these two factors in turn.
Companies that have a large buyback program ("buyback yield" 4 and 5) but trade at an expensive earnings multiple ("value quintile" 4 and 5) perform worse than companies that have a small buyback program but are inexpensive. In other words, it is better to buy an attractively valued company than one with a large buyback program. Compare the two types of companies in the circles.

Likewise, companies that have a large buyback program but poor earnings quality (i.e., manipulate or smooth earnings) perform worse than companies that have a small buyback program but have good earnings quality. In other words, it is better to buy a solid company than one with a large buyback program. Compare the two types of companies in the circles.

Share buyback programs are a net tailwind for the market and for individual stocks but there is much more to share performance than financial engineering.
If you find this post to be valuable, consider visiting a few of our sponsors who have offers that might be relevant to you.