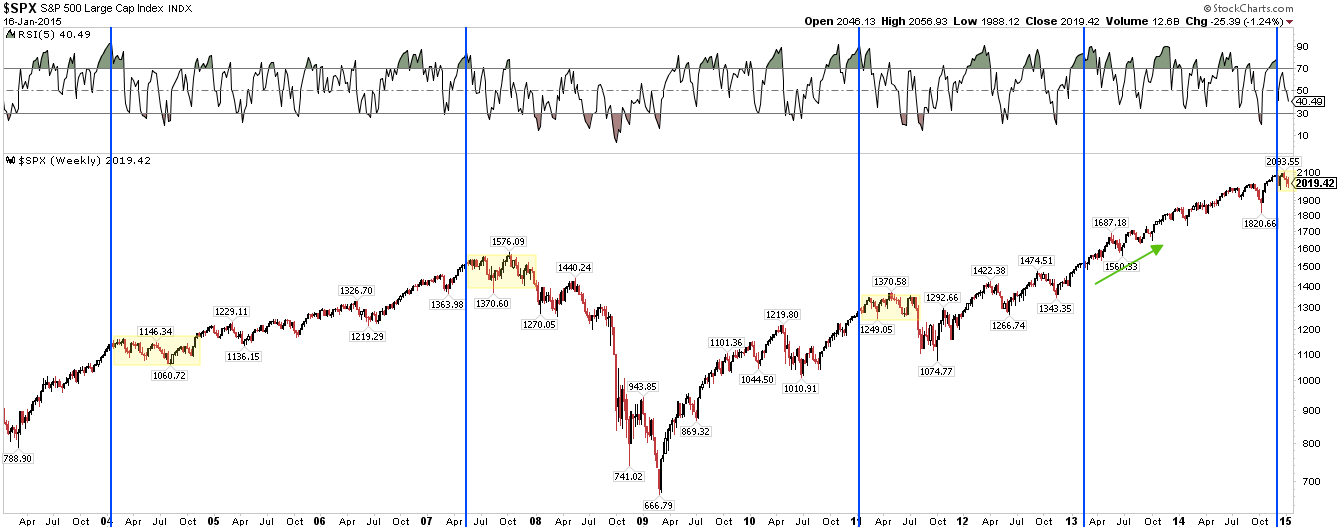
The lows a week ago pierced the 20-weekly ma. Strong uptrends remain above this line (arrows). This week, the market fell through again and then recovered, again. In the past, a close below the 20-wma has often led to a touch of the weekly Bollinger band bottom, currently at 189 (yellow). The key 20-wma level is now 200.5.

That SPY has fallen to its 20-wma on consecutive weeks is a sign of weakness. It's impressive that it keeps recovering but repeated touches normally leads to failure.
In the last 2 years, a 3 week decline of 5% has been the extent of most pullbacks in US equities. November 2012 was the last time a pullback lasted much longer. Expecting much more has been a losing proposition.

There are a few factors in equity's favor heading into this week.
Probably the most important is that the ECB has a policy meeting on Thursday, at which it may well provide details on its version of quantitative easing in order to combat the slump in European demand. Announcements to this effect have been greeted with enthusiasm in the past. It is not hard to imagine equities rising the next few days in anticipation. This was probably the catalyst for Friday's gain of 1.3%.
There was probably a short term low in equity bullishness this week. DSI (daily sentiment) was at a level consistent with recent lows in SPX (data from Chad Gassaway).

Similarly, equity put/call has also been elevated over the past month; when this rolls over, SPX has usually moved higher (data from Larry McMillan).

What is worrisome about put/call is the ratio started to roll lower a week ago, during which time equities have fallen. That has not been the pattern in the past; the rollover has lagged the lows in equities. To that end, note that there were no spikes higher in put/call this week, despite a strong sell off.
Likewise, although these surveys can lag, it must be noted that both AAII (individual investors) and NAAIM (active managers) saw an increase in bullishness this week. NAAIM respondents are 87% net long equities, an increase from 71% the week before. Both of these are consistent with put/call rolling lower.
It's rarely a positive when investors become more bullish as price heads lower, and that seems to be the case now. This makes us skeptical of how significant equities will rise before heading lower.
The Vix term structure also inverted this week. Vix has been elevated for most of the past month. Lows in SPX have mostly corresponded to times when the term structure has inverted. The watch out is that the early January inversion quickly reversed.

Finally, US treasuries might have experienced a blow off top, at least short term. Treasury investors' optimism (lower panel) has spiked higher, and these spikes usually correspond to at least a plateau in appreciation (data from Sentimentrader).

This happens to correspond to 30-year treasuries nearing a 20 year channel top; monthly RSI (5) is 90, which has also been consistent with a near term price plateau or top. Money moving out of treasuries would normally (but not always) benefit equities.

On balance, a rise in equities this week seems likely but, again, we are skeptical how far a bounce will go.
SPY has now fallen three weeks in a row. Excluding the 2008 bear market, SPY has fallen three weeks in a row 16 other times since 2003. In 15 of those, the index at least retested its low of the third week within the next three weeks. The one exception was in March 2004; price rose one week, but was lower 7 weeks later.

The same is true with RUT. It has been down three weeks in a row 14 other times since 2003, 13 of which were at the low again within three weeks. The one exception was last February; price rose the next 4 weeks, but was lower after 10 weeks.

The key watch out from the start of the year has been NDX. It was the only US index to peak in November and then make a lower high in December. NDX continues to lead to the downside; it slightly undercut its December lows this week. There are now two low highs and a lower low in NDX. That constitutes a downtrend. The pattern is a descending triangle (flat bottom, lower tops); these break lower 64% of the time according to Tom Bulkowski.

A potential positive for NDX is a trend line (dashed) from November 2013 that comes in near 4050, about 1% below Friday's low. There is also a 6 week supply of trading volume between 4000 and 4090 from August to October (yellow) that might provide support on further weakness. For now, the near term trend is down.
A week ago, SPX, RUT and DJIA did not have a lower high like NDX; now, all do. And all three are now also under their 50-dma. On weakness, the next obvious target is the December low. For DJIA, that happens to be near its 200-dma as well. On strength, look for resistance at last weeks high near 17,900 (dashed red line).

SPY now has a lower high. It is under a declining 5-dma and 13-ema; the 50-dma is flat. At best, this is a weak price trend. Regaining 203 would turn the slope of the 13-ema positive but 205 looks more formidable; that is the location of the line from the lower highs and its also weekly R1 next week and the pivot for the month of January. Regaining that level would be very positive. Like DJIA, the December low and the 200-dma are the obvious targets on weakness.

Since the start of the year, SPY has now gapped up 8 of 11 days, yet the price has moved lower 8 out of 11 days. In other words, the market drifts up over night and then mostly sells off during the day. The overnight gaps have netted a gain of $3.20, but SPY is lower YTD by $3.90. There has been more distribution than price is showing. It's not healthy.
Many sectors have retraced to their December lows. Banks have now lost that level. The same is true for transports. All the cyclical sectors are below their 50-dma; what are considered defensives (healthcare, utilities and staples) are all above their 50-dma. This pattern, too, is not healthy.

At its low this week, SPY was back at levels it traded at in August. There has been a lot of movement but not a lot of net progress.
What's going on? In early December, SPX completed a period of 7 weeks higher in a row. We looked at prior instances since the 1980s (here). There were 10 others; in 8 of these, SPX struggled to move higher for two months or longer. Some of these corresponded to major tops. In two instances, SPX largely continued higher. We seem to be repeating what has happened in the majority of cases; choppy, sideways action. US equities might be digesting the large gains made over the past 3 years; this has happened many times before and may well continue for several more months.
Lastly, outside the US, the highly disliked emerging markets are setting up an ascending triangle under 39.5. You can see it has formed this same pattern at lows before. Recall that fund managers are very underweight this region; a set up for outperformance in the past. Emerging markets correlate with commodities, so stabilization in oil and copper are likely to be necessary.

Monday is a market holiday to commemorate MLK. The days following are seasonally weak.

If you find this post to be valuable, consider visiting a few of our sponsors who have offers that might be relevant to you.