The story so far is this: 2013 started like a rocket, with SPX jumping ahead by 18% by mid May. This is twice its typical annual return. The conventional wisdom in May was SPX would quickly go to 1800 in 2013. It was in the bag.
Instead, in the 4 months since then, SPX has returned a net of zero. Moreover, risk/reward has been 3:1 negative during that period of time (i.e., upside relative to drawdown).
Despite this, core sentiment remains firmly in the 1800 and higher camp. To take advantage, fund managers have increased their equity exposure by more than a 1/3 since May (post).
So have individuals: according to Lipper, flows into equity funds and ETFs was the highest in more than 10 years last week (chart).
Since downside risk is considered minimal, margin debt also increased to a new high (chart).
And, not wanting to be left behind, former bears on Wall Street have capitulated (here).
There are few better examples of investor's confidence in the upside of equities than recent put/call ratios, which have been falling even as indices dropped over the past 7 sessions (chart). That's fairly remarkable behavior.
The big picture of a market losing momentum continues to be valid (post and chart below). Breadth confirms (chart). With investor expectations ahead of market performance, there is a potential for disappointment.

The debt ceiling debate is a potential negative trigger, like it was in the summer of 2011. Some commentators have drawn the parallel to the government shutdown of 1995-96, during which SPX actually rose. That's a poor analogy: then, EPS was growing 8-10% per year. Investors were responding, correctly, to terrific corporate performance. In comparison, EPS is currently struggling to maintain 2% growth.
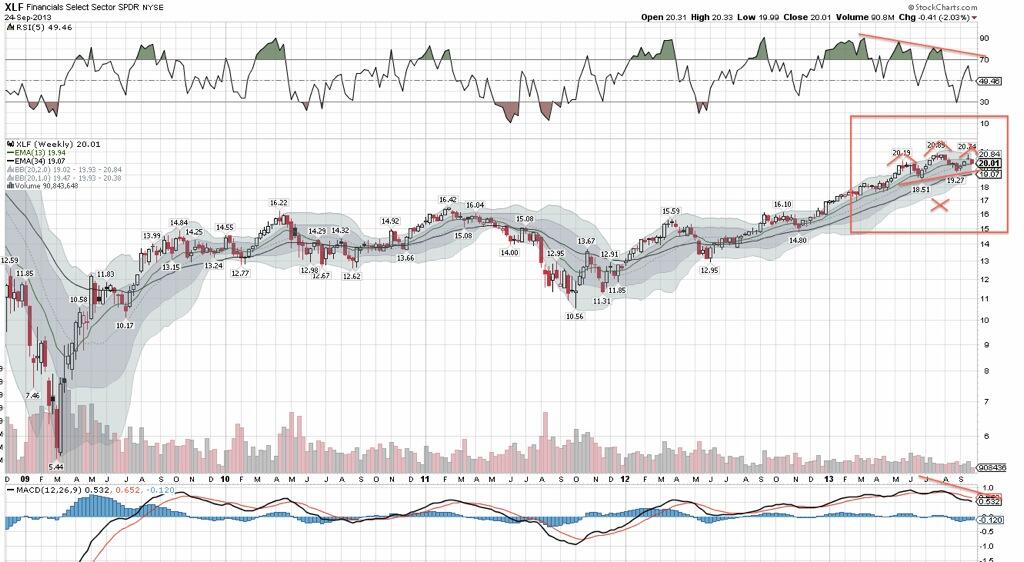
Of more importance than government talks is 3Q earnings, which start on October 8. Expectations are for 3.4% growth, led by more than 10% growth from financials (chart). Recall that 2Q EPS growth was negative without the high growth of financials. Into this, a warning about weak bank results appears to spell fundamental trouble (article and article). It's no surprise that banks have been a notable laggard recently, trading under their 50-dma (chart).
In August, only 3% of fund managers expected interest rates to be higher in 12-months (post). Funds were at a record underweight. Since then, treasuries have slightly outperformed equities (chart). The technical picture of treasuries is improving, regaining a key price level and a weekly MACD bullish crossover this week (chart below).

