Fund managers' cash remains at the highest levels since the panic of 2008-09. This is normally contrarian bullish.
Moreover, allocations to equities remain near the lowest levels in the past 3 years, levels at which prior lows in price have formed.
One concern is that fund managers remain very overweight "risk on" sectors: allocations to discretionary, banks and technology are above their means. Allocations to defensive sectors, like staples, are still low. In other words, there's a chance fund managers will make a further run to safety in the coming month(s).
Regionally, allocations to the US and emerging markets are at low levels from which they normally outperform on a relative basis.
* * *
Among the various ways of measuring investor sentiment, the BAML survey of global fund managers is one of the better as the results reflect how managers are allocated in various asset classes. These managers oversee a combined $600b in assets.
The data should be viewed mostly from a contrarian perspective; that is, when equities fall in price, allocations to cash go higher and allocations to equities go lower as investors become bearish, setting up a buy signal. When prices rise, the opposite occurs, setting up a sell signal. We did a recap of this pattern in December (post).
Last month, fund managers held 6-year high levels of cash and 3-year low levels of equities: a strong contrarian buy signal. The US and emerging markets were especially underweighted. Since then, SPX is up 5% and EEM is up about 10% (post).
Let's review the highlights from the past month.
Fund managers cash levels remained over 5% for a fourth month, the first time it's been this high for four months in a row since late-2008 and early-2009. This is an extreme and it's normally very bullish for equities (green shading).

Fund managers are +26% overweight equities, a massive drop from +41% in August and from near +60% at the start of 2015. In September, it was +17%, the lowest equity allocation since 2012. A washout low, with investors showing fear, takes place with equity allocations under 15-20%. This is therefore bullish.

US exposure decreased to -10% underweight in October. Despite low exposure, US equities have outperformed the past 6 months. US equities have been under-owned and should continue to outperform those in Europe and Japan on a relative basis (see below).

Eurozone exposure was +60% overweight in March, the highest in the survey's history. It is now back near those highs, at +54% overweight. This is 1.6 standard deviations above the long term mean. Judging from 2006, European equities are at risk of underperforming.

Allocations to Japan dropped to a 15 month low in September, and remain there in October (+23% overweight). This is still 0.7 standard deviations above the long term mean. Prior to September, allocations the past 10 months were the highest since April 2006. The region has underperformed the past 3 months.

Emerging markets exposure dropped to an all-time low in September (-34% underweight); it rose marginally to -28% in October. Fund managers have been right to underweight this region, but current allocations are an extreme comparable only to early 2014, from which the region began to strongly outperform for the next half a year. The region is up nearly 10% in the past month.

Fund managers are -41% underweight bonds (a rise from -60% in August). Bonds continue to be the most underweighted asset class and this, in large part, explains why cash balances have not been lower that 4.5% in two years. Fund managers have been right to be underweight bonds, but note that bonds have now strongly outperformed in the past 6 months.

Fund managers are the most bearish on 10-year rates in the past 3 years. There will be a contrarian set-up if the percent of fund managers expecting higher rates continues to fall: the cyclical low in rates was mid-2012 (arrow) and big rallies in rates in early 2009, late-2010 and late-2011 (highlights).

They are also the most bearish on global growth since July 2012; coincidentally, that was the low in equities after a 10% fall.

Allocations to commodities rose to -23% underweight from -32% underweight in September. This is still 1.3 standard deviations below the long term mean. The low allocation to commodities goes together with pessimism towards emerging markets and also explains why cash balances are high.

While managers have reduced their equity exposure, they remain overweight the highest beta equities (technology, discretionary, banks). The largest underweights are in commodities (including energy and materials) and defensives, like staples. Of note is that the weighting towards industrials has dropped to a 3-year low.

Fund managers' allocation to energy is 2.1 standard deviations below the mean.
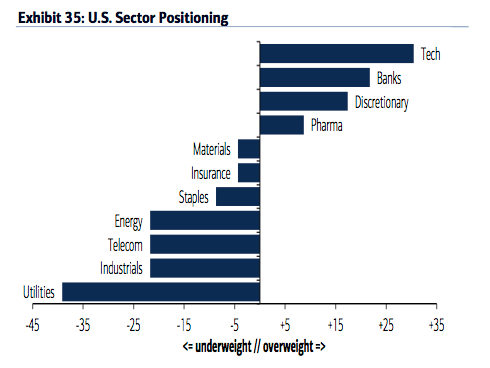
In the US, pharma (biotech), discretionary, banks and tech are the most favored sectors. This has been the case for many months. Utilities, staples, telecoms (defensives) remain underweighted, with energy.

In summary: Fund managers are still overweight cash and their equity allocations remain near 3-year lows. These two factors are consistent with positive equity performance in following months. That might be especially true for the US and emerging market equities. Continued high allocations to cyclicals (tech, banks, discretionary) are the biggest concern; in other words, there's a chance fund managers will make a further run to safety in the coming month(s).
Survey details are below.
- Cash (5.1%): Cash balances dropped to a still high 5.1% from 5.5%. July and September were the highest cash levels since December 2008. Typical range is 3.5-5%. BAML has a 4.5% contrarian buy level but we consider over 5% to be a better signal. More on this indicator here.
- Equities (+26%): A net +26% are overweight global equities, up from a contrarian bullish +17% in September. Over +50% is bearish. A washout low (bullish) would be under +15-20%. More on this indicator here.
- Regions:
- US (-10%): Exposure to the US dropped from -6% to -10% underweight. It was -19% underweight in May, the lowest since January 2008. For comparison, it was +24% overweight in January.
- Europe (+54%): Exposure to Europe increased to +54% overweight from +45% overweight in August.
- Japan (+23%): Managers are +23% overweight Japan, a big drop from +40% in August but flat from last month. Funds were -20% underweight in December 2012 when the Japanese rally began.
- EEM (-28%): Managers increased their EEM exposure to -28% underweight from -34% in September, the lowest in the survey's history.
- Bonds (-41%): A net -41% are underweight bonds, a rise from -60% in July and August. For comparison, they were -38% underweight in May 2013 before the large fall in bond prices.
- Commodities (-23%): Managers commodity exposure increased to -23% underweight from -32% underweight in September, which was a 28-month low. Low commodity exposure goes in hand with low sentiment towards EEM.
- Macro: Only 13% expect a stronger global economy over the next 12 months, a 3 year low.
If you find this post to be valuable, consider visiting a few of our sponsors who have offers that might be relevant to you.